Charts / Chart
Land-casino revenue before 2020 and in the latest comparable period
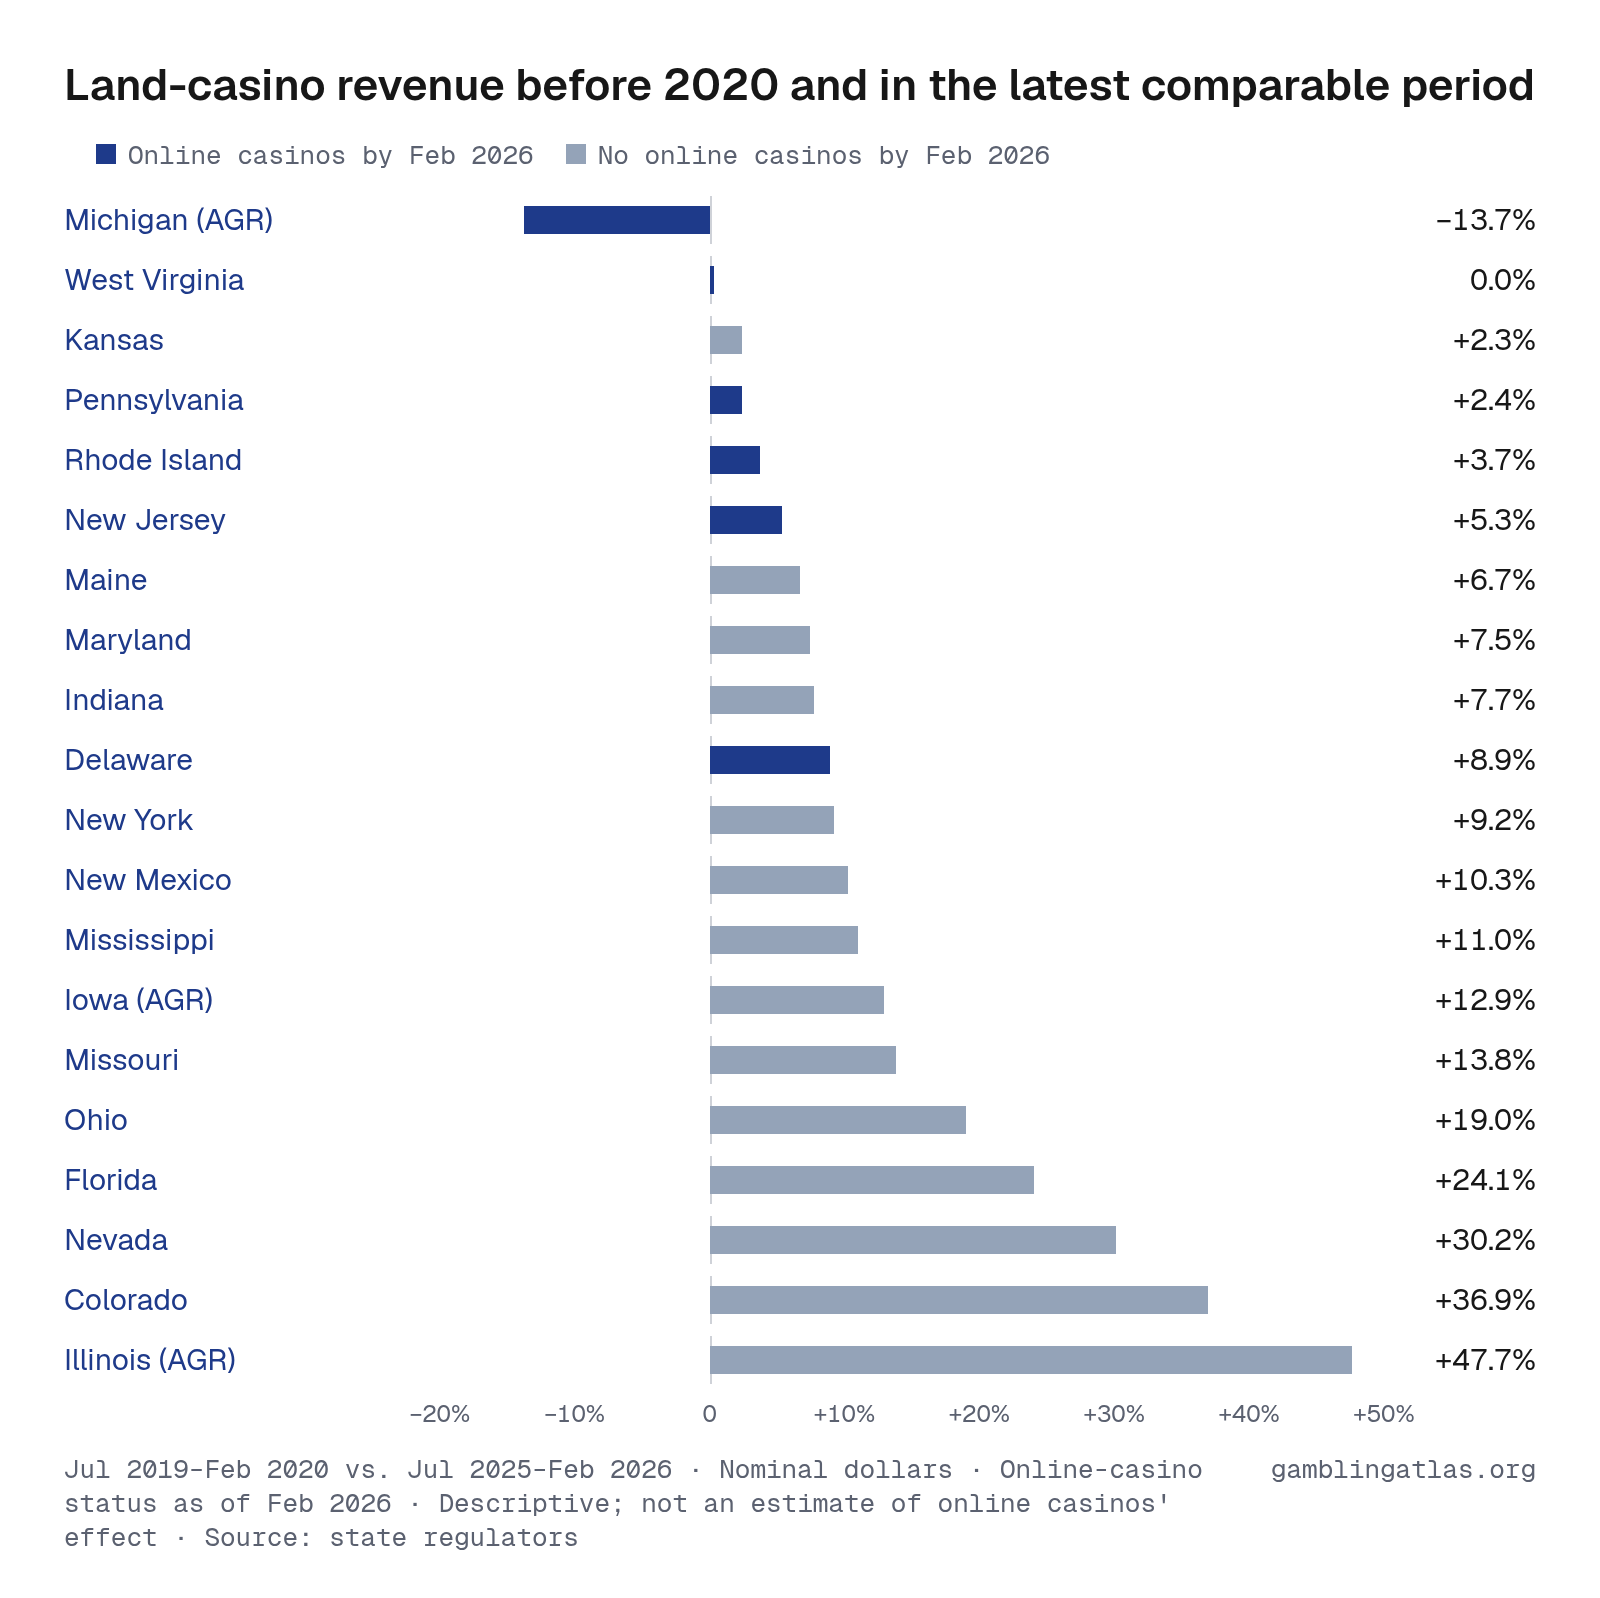
Comparing Jul 2025–Feb 2026 with Jul 2019–Feb 2020, land casino revenue is higher in 19 of 20 states and lower in 1. Figures are nominal. Consumer prices rose 26% between the two periods, so revenue grew faster than inflation only in Illinois, Colorado and Nevada. Illinois (AGR) rose most (+48%); Michigan (AGR) fell most (−14%).
Commercial casino revenue in nominal dollars (GGR, or AGR where marked), Jul 2019–Feb 2020 compared with the same eight months of Jul 2025–Feb 2026. The earlier period is the last eight months before COVID closed casinos in March 2020. States are grouped by whether online casinos had reported revenue by Feb 2026. Online-casino launches: Delaware Oct 2013, New Jersey Nov 2013, Pennsylvania Jul 2019, West Virginia Jul 2020, Michigan Jan 2021 and Rhode Island Mar 2024. Excluded: Arkansas, Louisiana, Massachusetts, Nebraska, South Dakota and Virginia, which didn't report all 16 months. These state differences are descriptive. They do not estimate the effect of online casinos on land-casino revenue.
Jul 2019–Feb 2020 vs. Jul 2025–Feb 2026 · Nominal dollars · Online-casino status as of Feb 2026 · Descriptive; not an estimate of online casinos' effect · Source: state regulators · Revenue
Download, embed or cite
Free to reuse with a link to this page. License and sources
Data
| State | Change (nominal) | Change after inflation | Online casinos by Feb 2026 | Online casino launch |
|---|---|---|---|---|
| Michigan (AGR) | -14% | -32% | Yes | Jan 2021 |
| West Virginia | 0% | -21% | Yes | Jul 2020 |
| Kansas | 2% | -19% | No | |
| Pennsylvania | 2% | -19% | Yes | Jul 2019 |
| Rhode Island | 4% | -18% | Yes | Mar 2024 |
| New Jersey | 5% | -17% | Yes | Nov 2013 |
| Maine | 7% | -15% | No | |
| Maryland | 7% | -15% | No | |
| Indiana | 8% | -15% | No | |
| Delaware | 9% | -14% | Yes | Oct 2013 |
| New York | 9% | -13% | No | |
| New Mexico | 10% | -13% | No | |
| Mississippi | 11% | -12% | No | |
| Iowa (AGR) | 13% | -11% | No | |
| Missouri | 14% | -10% | No | |
| Ohio | 19% | -6% | No | |
| Florida | 24% | -2% | No | |
| Nevada | 30% | 3% | No | |
| Colorado | 37% | 8% | No | |
| Illinois (AGR) | 48% | 17% | No |
Commercial casino revenue in nominal dollars (GGR, or AGR where marked), Jul 2019–Feb 2020 compared with the same eight months of Jul 2025–Feb 2026. The earlier period is the last eight months before COVID closed casinos in March 2020. States are grouped by whether online casinos had reported revenue by Feb 2026. Online-casino launches: Delaware Oct 2013, New Jersey Nov 2013, Pennsylvania Jul 2019, West Virginia Jul 2020, Michigan Jan 2021 and Rhode Island Mar 2024. Excluded: Arkansas, Louisiana, Massachusetts, Nebraska, South Dakota and Virginia, which didn't report all 16 months. These state differences are descriptive. They do not estimate the effect of online casinos on land-casino revenue.
Sources
Related charts
By state
Colorado · Delaware · Florida · Illinois · Indiana · Iowa · Kansas · Louisiana · Maine · Maryland · Massachusetts · Michigan · Mississippi · Missouri · Nebraska · Nevada · New Jersey · New Mexico · New York · Ohio · Pennsylvania · Rhode Island · South Dakota · Virginia · West Virginia