States / New Mexico / Chart
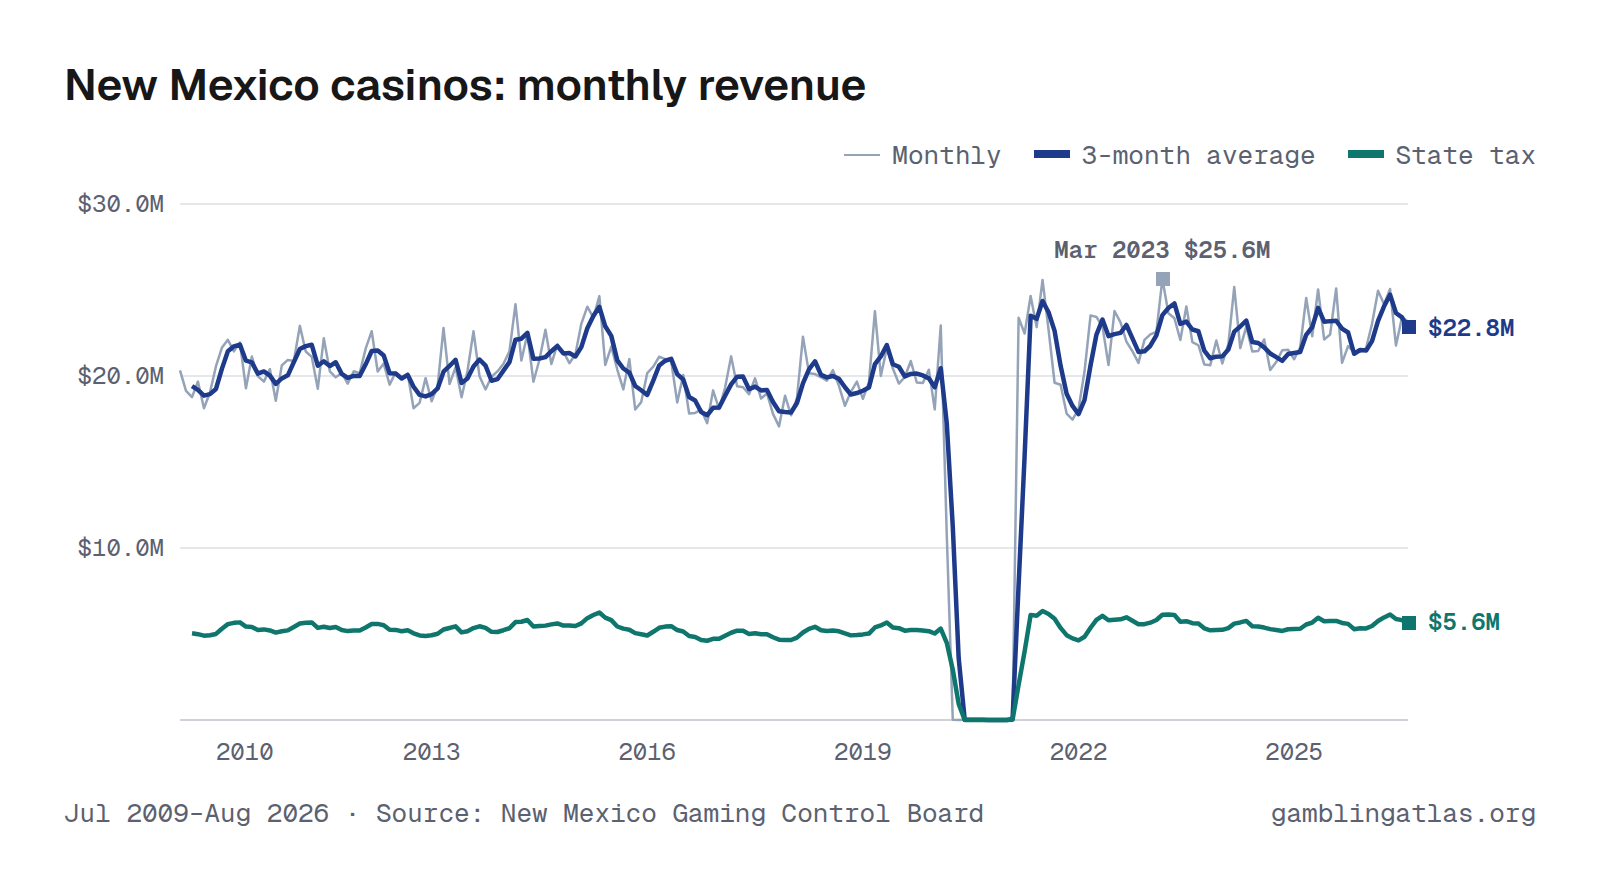
New Mexico Casino Revenue by Month
New Mexico casinos produced $23.2M in gross gaming revenue in August 2026, down 8% from Aug 2025. Over the 12 months through Aug 2026, revenue totaled $272M, and the state collected $67.6M in tax. In the shared comparison window Sep 2025–Aug 2026, it ranked 22nd largest of 25 states with monthly casino revenue.
The highest month on record here is Mar 2023 ($25.6M). Monthly figures run from Jul 2009 to Aug 2026 and come from the New Mexico Gaming Control Board.
Jul 2009–Aug 2026 · Source: New Mexico Gaming Control Board · New Mexico revenue
Download, embed or cite
Free to reuse with a link to this page. License and sources
Data
| Month | Revenue (GGR) | State tax |
|---|---|---|
| Aug 2026 | $23.2M | $5.7M |
| Jul 2026 | $23.4M | $5.8M |
| Jun 2026 | $21.8M | $5.4M |
| May 2026 | $25.1M | $6.2M |
| Apr 2026 | $24.2M | $6.0M |
| Mar 2026 | $25.0M | $6.2M |
| Feb 2026 | $23.0M | $5.7M |
| Jan 2026 | $21.6M | $5.4M |
| Dec 2025 | $21.4M | $5.3M |
| Nov 2025 | $21.4M | $5.3M |
| Oct 2025 | $21.7M | $5.4M |
| Sep 2025 | $20.8M | $5.1M |
| Aug 2025 | $25.1M | $6.2M |
| Jul 2025 | $22.4M | $5.6M |
| Jun 2025 | $22.1M | $5.5M |
| May 2025 | $25.0M | $6.2M |
| Apr 2025 | $22.3M | $5.5M |
| Mar 2025 | $24.5M | $6.1M |
| Feb 2025 | $21.7M | $5.4M |
| Jan 2025 | $21.0M | $5.2M |
| Dec 2024 | $21.5M | $5.3M |
| Nov 2024 | $21.5M | $5.3M |
| Oct 2024 | $20.8M | $5.2M |
| Sep 2024 | $20.3M | $5.0M |
| Aug 2024 | $22.1M | $5.5M |
| Jul 2024 | $21.5M | $5.3M |
| Jun 2024 | $21.4M | $5.3M |
| May 2024 | $22.9M | $5.7M |
| Apr 2024 | $21.6M | $5.4M |
| Mar 2024 | $25.2M | $6.2M |
| Feb 2024 | $21.8M | $5.4M |
| Jan 2024 | $20.7M | $5.1M |
| Dec 2023 | $22.1M | $5.5M |
| Nov 2023 | $20.6M | $5.1M |
| Oct 2023 | $20.7M | $5.1M |
| Sep 2023 | $21.8M | $5.4M |
| Aug 2023 | $22.0M | $5.4M |
| Jul 2023 | $24.0M | $6.0M |
| Jun 2023 | $22.1M | $5.5M |
| May 2023 | $23.4M | $5.8M |
| Apr 2023 | $23.6M | $5.9M |
| Mar 2023 | $25.6M | $6.7M |
| Feb 2023 | $22.6M | $5.9M |
| Jan 2023 | $22.4M | $5.8M |
| Dec 2022 | $22.1M | $5.7M |
| Nov 2022 | $20.8M | $5.4M |
| Oct 2022 | $21.4M | $5.6M |
| Sep 2022 | $22.0M | $5.7M |
| Aug 2022 | $23.1M | $6.0M |
| Jul 2022 | $23.8M | $6.2M |
| Jun 2022 | $20.6M | $5.4M |
| May 2022 | $22.9M | $6.0M |
| Apr 2022 | $23.4M | $6.1M |
| Mar 2022 | $23.5M | $6.1M |
| Feb 2022 | $20.3M | $5.3M |
| Jan 2022 | $18.1M | $4.7M |
| Dec 2021 | $17.5M | $4.5M |
| Nov 2021 | $17.8M | $4.6M |
| Oct 2021 | $19.5M | $5.1M |
| Sep 2021 | $19.6M | $5.1M |
| Aug 2021 | $22.7M | $5.9M |
| Jul 2021 | $25.6M | $6.7M |
| Jun 2021 | $22.8M | $5.9M |
| May 2021 | $24.7M | $6.4M |
| Apr 2021 | $22.5M | $5.8M |
| Mar 2021 | $23.4M | $6.1M |
| Feb 2021 | $196K | $51.0K |
| Jan 2021 | $0 | $0 |
| Dec 2020 | $0 | $0 |
| Nov 2020 | $0 | $0 |
| Oct 2020 | $0 | $0 |
| Sep 2020 | $5,281 | $1,373 |
| Aug 2020 | $9,026 | $2,347 |
| Jul 2020 | $13.5K | $3,506 |
| Jun 2020 | $18.0K | $4,683 |
| May 2020 | $5,234 | $1,361 |
| Apr 2020 | $12.4K | $3,218 |
| Mar 2020 | $10.8M | $2.8M |
| Feb 2020 | $22.9M | $6.0M |
| Jan 2020 | $18.1M | $4.7M |
| Dec 2019 | $20.4M | $5.3M |
| Nov 2019 | $19.6M | $5.1M |
| Oct 2019 | $19.6M | $5.1M |
| Sep 2019 | $20.9M | $5.4M |
| Aug 2019 | $19.9M | $5.2M |
| Jul 2019 | $19.6M | $5.1M |
| Jun 2019 | $20.4M | $5.3M |
| May 2019 | $21.6M | $5.6M |
| Apr 2019 | $20.0M | $5.2M |
| Mar 2019 | $23.8M | $6.2M |
| Feb 2019 | $19.6M | $5.1M |
| Jan 2019 | $18.7M | $4.9M |
| Dec 2018 | $19.7M | $5.1M |
| Nov 2018 | $19.1M | $5.0M |
| Oct 2018 | $18.3M | $4.7M |
| Sep 2018 | $19.4M | $5.1M |
| Aug 2018 | $20.3M | $5.3M |
| Jul 2018 | $19.7M | $5.1M |
| Jun 2018 | $19.9M | $5.2M |
| May 2018 | $20.1M | $5.2M |
| Apr 2018 | $20.2M | $5.2M |
| Mar 2018 | $22.3M | $5.8M |
| Feb 2018 | $18.7M | $4.9M |
| Jan 2018 | $17.7M | $4.6M |
| Dec 2017 | $18.9M | $4.9M |
| Nov 2017 | $17.1M | $4.4M |
| Oct 2017 | $17.8M | $4.6M |
| Sep 2017 | $19.0M | $4.9M |
| Aug 2017 | $18.7M | $4.9M |
| Jul 2017 | $19.9M | $5.2M |
| Jun 2017 | $18.9M | $4.9M |
| May 2017 | $19.3M | $5.0M |
| Apr 2017 | $19.4M | $5.0M |
| Mar 2017 | $21.1M | $5.5M |
| Feb 2017 | $19.3M | $5.0M |
| Jan 2017 | $18.1M | $4.7M |
| Dec 2016 | $19.2M | $5.0M |
| Nov 2016 | $17.3M | $4.5M |
| Oct 2016 | $18.0M | $4.7M |
| Sep 2016 | $17.9M | $4.6M |
| Aug 2016 | $17.8M | $4.6M |
| Jul 2016 | $20.1M | $5.2M |
| Jun 2016 | $18.5M | $4.8M |
| May 2016 | $20.9M | $5.4M |
| Apr 2016 | $21.0M | $5.5M |
| Mar 2016 | $21.1M | $5.5M |
| Feb 2016 | $20.6M | $5.3M |
| Jan 2016 | $20.2M | $5.2M |
| Dec 2015 | $18.5M | $4.8M |
| Nov 2015 | $18.1M | $4.7M |
| Oct 2015 | $21.0M | $5.5M |
| Sep 2015 | $19.2M | $5.0M |
| Aug 2015 | $20.4M | $5.3M |
| Jul 2015 | $21.7M | $5.6M |
| Jun 2015 | $20.6M | $5.4M |
| May 2015 | $24.6M | $6.4M |
| Apr 2015 | $23.4M | $6.1M |
| Mar 2015 | $24.0M | $6.2M |
| Feb 2015 | $23.0M | $6.0M |
| Jan 2015 | $21.3M | $5.5M |
| Dec 2014 | $20.7M | $5.3M |
| Nov 2014 | $21.4M | $5.5M |
| Oct 2014 | $21.8M | $5.6M |
| Sep 2014 | $20.7M | $5.3M |
| Aug 2014 | $22.7M | $5.9M |
| Jul 2014 | $20.9M | $5.4M |
| Jun 2014 | $19.7M | $5.1M |
| May 2014 | $22.4M | $5.8M |
| Apr 2014 | $20.9M | $5.4M |
| Mar 2014 | $24.2M | $6.2M |
| Feb 2014 | $21.4M | $5.5M |
| Jan 2014 | $20.7M | $5.3M |
| Dec 2013 | $20.3M | $5.2M |
| Nov 2013 | $20.0M | $5.2M |
| Oct 2013 | $19.2M | $5.0M |
| Sep 2013 | $20.0M | $5.2M |
| Aug 2013 | $22.6M | $5.9M |
| Jul 2013 | $20.3M | $5.3M |
| Jun 2013 | $18.8M | $4.9M |
| May 2013 | $20.5M | $5.3M |
| Apr 2013 | $19.5M | $5.1M |
| Mar 2013 | $22.8M | $5.9M |
| Feb 2013 | $19.4M | $5.1M |
| Jan 2013 | $18.5M | $4.8M |
| Dec 2012 | $19.9M | $5.2M |
| Nov 2012 | $18.4M | $4.8M |
| Oct 2012 | $18.1M | $4.7M |
| Sep 2012 | $20.1M | $5.2M |
| Aug 2012 | $19.9M | $5.2M |
| Jul 2012 | $20.2M | $5.3M |
| Jun 2012 | $19.5M | $5.1M |
| May 2012 | $20.7M | $5.4M |
| Apr 2012 | $20.3M | $5.3M |
| Mar 2012 | $22.6M | $5.9M |
| Feb 2012 | $21.6M | $5.6M |
| Jan 2012 | $20.2M | $5.2M |
| Dec 2011 | $20.3M | $5.3M |
| Nov 2011 | $19.6M | $5.1M |
| Oct 2011 | $20.2M | $5.2M |
| Sep 2011 | $19.9M | $5.2M |
| Aug 2011 | $20.3M | $5.3M |
| Jul 2011 | $22.2M | $5.8M |
| Jun 2011 | $19.3M | $5.0M |
| May 2011 | $21.1M | $5.5M |
| Apr 2011 | $21.4M | $5.6M |
| Mar 2011 | $22.9M | $6.0M |
| Feb 2011 | $20.9M | $5.4M |
| Jan 2011 | $20.9M | $5.4M |
| Dec 2010 | $20.6M | $5.4M |
| Nov 2010 | $18.6M | $4.8M |
| Oct 2010 | $20.4M | $5.3M |
| Sep 2010 | $19.7M | $5.1M |
| Aug 2010 | $20.0M | $5.2M |
| Jul 2010 | $21.1M | $5.5M |
| Jun 2010 | $19.3M | $5.0M |
| May 2010 | $21.9M | $5.7M |
| Apr 2010 | $21.4M | $5.6M |
| Mar 2010 | $22.1M | $5.7M |
| Feb 2010 | $21.6M | $5.6M |
| Jan 2010 | $20.6M | $5.3M |
| Dec 2009 | $19.0M | $5.0M |
| Nov 2009 | $18.1M | $4.7M |
| Oct 2009 | $19.7M | $5.1M |
| Sep 2009 | $18.8M | $4.9M |
| Aug 2009 | $19.1M | $5.0M |
| Jul 2009 | $20.3M | $5.3M |
| Year | Revenue (GGR) | State tax |
|---|---|---|
| 2026 | $187M (8 mo) | $46.4M (8 mo) |
| 2025 | $269M | $66.8M |
| 2024 | $261M | $64.8M |
| 2023 | $271M | $68.0M |
| 2022 | $262M | $68.1M |
| 2021 | $216M | $56.2M |
| 2020 | $51.8M | $13.5M |
| 2019 | $244M | $63.5M |
| 2018 | $235M | $61.2M |
| 2017 | $228M | $59.2M |
| 2016 | $232M | $60.4M |
| 2015 | $256M | $66.5M |
| 2014 | $258M | $66.5M |
| 2013 | $242M | $62.8M |
| 2012 | $241M | $62.8M |
| 2011 | $249M | $64.7M |
| 2010 | $247M | $64.3M |
| 2009 | $115M (6 mo) | $29.9M (6 mo) |
Years with missing months show partial totals, marked with the number of months reported.
Notes
Retail: GGR is the Gaming Control Board's monthly "Quick Facts" report, the "Gaming Machine Net Win/Net Take" line for Racetrack Operators. Tax paid is the same report's "Gaming Tax" line for Racetrack Operators. Covers slot machine revenue at the Board's 5 licensed racetrack casinos; excludes the report's separate Non-Profit Operators (fraternal/veterans-club) machine gaming line and tribal casinos, which operate under compacts and report separately.
Sources
Related charts
Same chart for other states
Colorado · Delaware · Florida · Illinois · Indiana · Iowa · Kansas · Louisiana · Maine · Maryland · Massachusetts · Michigan · Mississippi · Missouri · Nebraska · Nevada · New Jersey · New York · Ohio · Pennsylvania · Rhode Island · South Dakota · Virginia · West Virginia