States / New Jersey / Chart
New Jersey Casino Revenue and Handle by Month
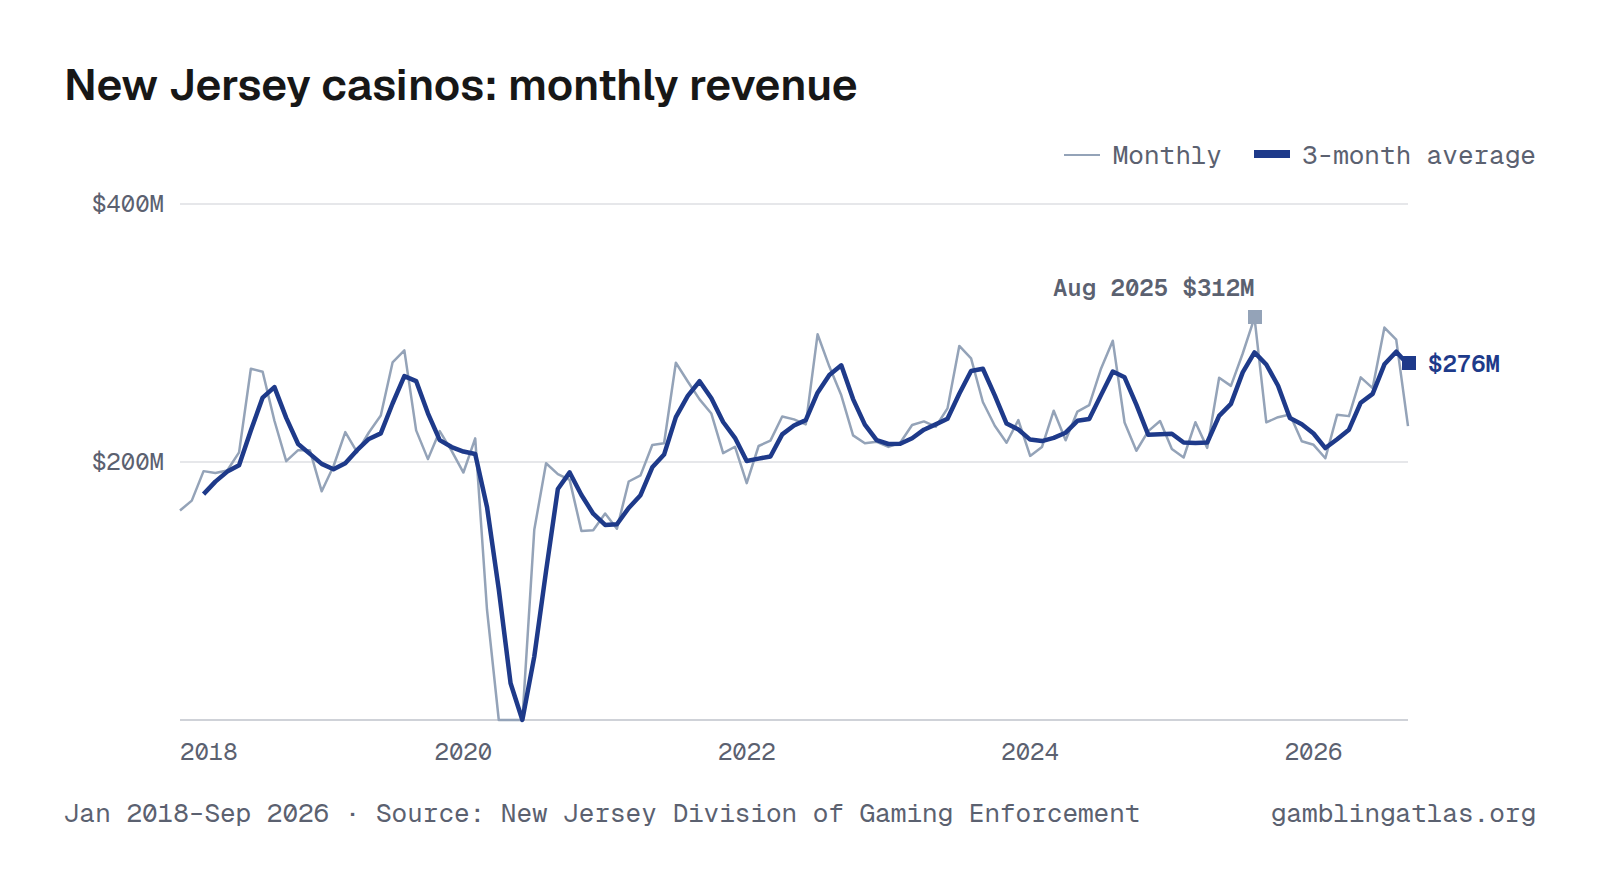
New Jersey casinos produced $228M in gross gaming revenue in September 2026, down 1% from Sep 2025. Over the 12 months through Sep 2026, revenue totaled $2.93B on $27.3B in bets, a 10.7% hold. In the shared comparison window Sep 2025–Aug 2026, it ranked 3rd largest of 25 states with monthly casino revenue.
The highest month on record here is Aug 2025 ($312M). Monthly figures run from Jan 2018 to Sep 2026 and come from the New Jersey Division of Gaming Enforcement.
Jan 2018–Sep 2026 · Source: New Jersey Division of Gaming Enforcement · New Jersey revenue
Handle (amount bet)
Download, embed or cite
Free to reuse with a link to this page. License and sources
Data
| Month | Handle | Revenue (GGR) | Hold |
|---|---|---|---|
| Sep 2026 | $2.19B | $228M | 10.4% |
| Aug 2026 | $2.77B | $295M | 10.7% |
| Jul 2026 | $2.79B | $304M | 10.9% |
| Jun 2026 | $2.34B | $257M | 11.0% |
| May 2026 | $2.53B | $266M | 10.5% |
| Apr 2026 | $2.13B | $236M | 11.1% |
| Mar 2026 | $2.19B | $237M | 10.8% |
| Feb 2026 | $1.94B | $203M | 10.5% |
| Jan 2026 | $1.97B | $213M | 10.8% |
| Dec 2025 | $2.06B | $216M | 10.5% |
| Nov 2025 | $2.15B | $237M | 11.0% |
| Oct 2025 | $2.20B | $235M | 10.7% |
| Sep 2025 | $2.19B | $231M | 10.5% |
| Aug 2025 | $2.92B | $312M | 10.7% |
| Jul 2025 | $2.68B | $284M | 10.6% |
| Jun 2025 | $2.36B | $259M | 11.0% |
| May 2025 | $2.48B | $265M | 10.7% |
| Apr 2025 | $2.08B | $211M | 10.2% |
| Mar 2025 | $2.25B | $231M | 10.3% |
| Feb 2025 | $1.97B | $203M | 10.3% |
| Jan 2025 | $1.94B | $210M | 10.8% |
| Dec 2024 | $2.13B | $232M | 10.9% |
| Nov 2024 | $2.15B | $224M | 10.4% |
| Oct 2024 | $2.03B | $209M | 10.3% |
| Sep 2024 | $2.23B | $231M | 10.4% |
| Aug 2024 | $2.77B | $294M | 10.6% |
| Jul 2024 | $2.66B | $272M | 10.3% |
| Jun 2024 | $2.31B | $244M | 10.6% |
| May 2024 | $2.29B | $239M | 10.4% |
| Apr 2024 | $2.04B | $217M | 10.6% |
| Mar 2024 | $2.25B | $240M | 10.7% |
| Feb 2024 | $2.03B | $212M | 10.4% |
| Jan 2024 | $1.89B | $205M | 10.8% |
| Dec 2023 | $2.23B | $232M | 10.4% |
| Nov 2023 | $2.04B | $215M | 10.5% |
| Oct 2023 | $2.11B | $228M | 10.8% |
| Sep 2023 | $2.32B | $247M | 10.6% |
| Aug 2023 | $2.68B | $280M | 10.5% |
| Jul 2023 | $2.80B | $290M | 10.4% |
| Jun 2023 | $2.33B | $242M | 10.4% |
| May 2023 | $2.20B | $227M | 10.3% |
| Apr 2023 | $2.20B | $231M | 10.5% |
| Mar 2023 | $2.16B | $229M | 10.6% |
| Feb 2023 | $2.04B | $215M | 10.5% |
| Jan 2023 | $2.00B | $212M | 10.6% |
| Dec 2022 | $1.78B | $216M | 12.1% |
| Nov 2022 | $1.81B | $215M | 11.9% |
| Oct 2022 | $1.94B | $221M | 11.4% |
| Sep 2022 | $2.13B | $252M | 11.8% |
| Aug 2022 | $2.60B | $274M | 10.5% |
| Jul 2022 | $2.77B | $299M | 10.8% |
| Jun 2022 | $2.20B | $229M | 10.4% |
| May 2022 | $2.24B | $233M | 10.4% |
| Apr 2022 | $2.21B | $235M | 10.6% |
| Mar 2022 | $2.01B | $217M | 10.8% |
| Feb 2022 | $1.97B | $212M | 10.8% |
| Jan 2022 | $1.72B | $184M | 10.7% |
| Dec 2021 | $1.94B | $212M | 10.9% |
| Nov 2021 | $2.01B | $207M | 10.3% |
| Oct 2021 | $2.28B | $238M | 10.4% |
| Sep 2021 | $2.36B | $249M | 10.5% |
| Aug 2021 | $2.56B | $262M | 10.3% |
| Jul 2021 | $2.65B | $277M | 10.4% |
| Jun 2021 | $2.02B | $215M | 10.6% |
| May 2021 | $2.04B | $213M | 10.4% |
| Apr 2021 | $1.78B | $190M | 10.6% |
| Mar 2021 | $1.72B | $185M | 10.7% |
| Feb 2021 | $1.42B | $148M | 10.4% |
| Jan 2021 | $1.51B | $160M | 10.6% |
| Dec 2020 | $1.35B | $147M | 10.9% |
| Nov 2020 | $1.40B | $147M | 10.5% |
| Oct 2020 | $1.77B | $186M | 10.5% |
| Sep 2020 | $1.85B | $191M | 10.3% |
| Aug 2020 | $1.85B | $199M | 10.7% |
| Jul 2020 | $1.43B | $147M | 10.3% |
| Jun 2020 | $23.8K | ||
| May 2020 | $22.8K | ||
| Apr 2020 | $17.0K | ||
| Mar 2020 | $808M | $85.5M | 10.6% |
| Feb 2020 | $2.06B | $218M | 10.6% |
| Jan 2020 | $1.92B | $192M | 10.0% |
| Dec 2019 | $2.01B | $209M | 10.4% |
| Nov 2019 | $2.10B | $224M | 10.7% |
| Oct 2019 | $1.95B | $202M | 10.4% |
| Sep 2019 | $2.12B | $225M | 10.6% |
| Aug 2019 | $2.73B | $286M | 10.5% |
| Jul 2019 | $2.60B | $277M | 10.7% |
| Jun 2019 | $2.23B | $236M | 10.6% |
| May 2019 | $2.18B | $223M | 10.2% |
| Apr 2019 | $1.93B | $208M | 10.7% |
| Mar 2019 | $2.18B | $223M | 10.2% |
| Feb 2019 | $1.77B | $197M | 11.1% |
| Jan 2019 | $1.81B | $177M | 9.8% |
| Dec 2018 | $2.04B | $209M | 10.2% |
| Nov 2018 | $2.03B | $209M | 10.3% |
| Oct 2018 | $1.93B | $201M | 10.4% |
| Sep 2018 | $2.27B | $232M | 10.2% |
| Aug 2018 | $2.60B | $270M | 10.4% |
| Jul 2018 | $2.62B | $272M | 10.4% |
| Jun 2018 | $2.08B | $207M | 10.0% |
| May 2018 | $1.94B | $193M | 10.0% |
| Apr 2018 | $1.85B | $191M | 10.3% |
| Mar 2018 | $1.84B | $193M | 10.5% |
| Feb 2018 | $1.68B | $170M | 10.1% |
| Jan 2018 | $1.58B | $162M | 10.3% |
| Year | Handle | Revenue (GGR) |
|---|---|---|
| 2026 | $20.8B (9 mo) | $2.24B (9 mo) |
| 2025 | $27.3B | $2.89B |
| 2024 | $26.8B | $2.82B |
| 2023 | $27.1B | $2.85B |
| 2022 | $25.4B | $2.79B |
| 2021 | $24.3B | $2.55B |
| 2020 | $14.4B (9 mo) | $1.51B |
| 2019 | $25.6B | $2.69B |
| 2018 | $24.5B | $2.51B |
Years with missing months show partial totals, marked with the number of months reported.
| Operator | Handle | GGR |
|---|---|---|
| Borgata | $7.47B | $813M |
| Caesars Entertainment | $6.25B | $658M |
| Hard Rock Digital | $5.01B | $548M |
| Ocean Casino Resort | $4.47B | $488M |
| Mohegan | $1.55B | $157M |
| Golden Nugget | $1.26B | $131M |
| Bally's Corporation | $1.23B | $130M |
License-holder totals may include partner-operated brands.
Notes
GGR is the monthly gross revenue report's "Total Casino Win" for slots and table games. The monthly casino return has no tax line.
Sources
- NJ DGE-101 Monthly Gross Revenue Report June
- NJ DGE-101 Monthly Gross Revenue Report March
- NJ DGE-101 Monthly Gross Revenue Report May
- NJ DGE-101 Monthly Gross Revenue Report November
- NJ DGE-101 Monthly Gross Revenue Report October
- NJ DGE-101 Monthly Gross Revenue Report September
Related charts
Same chart for other states
Colorado · Delaware · Florida · Illinois · Indiana · Iowa · Kansas · Louisiana · Maine · Maryland · Massachusetts · Michigan · Mississippi · Missouri · Nebraska · Nevada · New Mexico · New York · Ohio · Pennsylvania · Rhode Island · South Dakota · Virginia · West Virginia