States / New Jersey / Chart
New Jersey Retail Sports Betting Revenue and Handle by Month
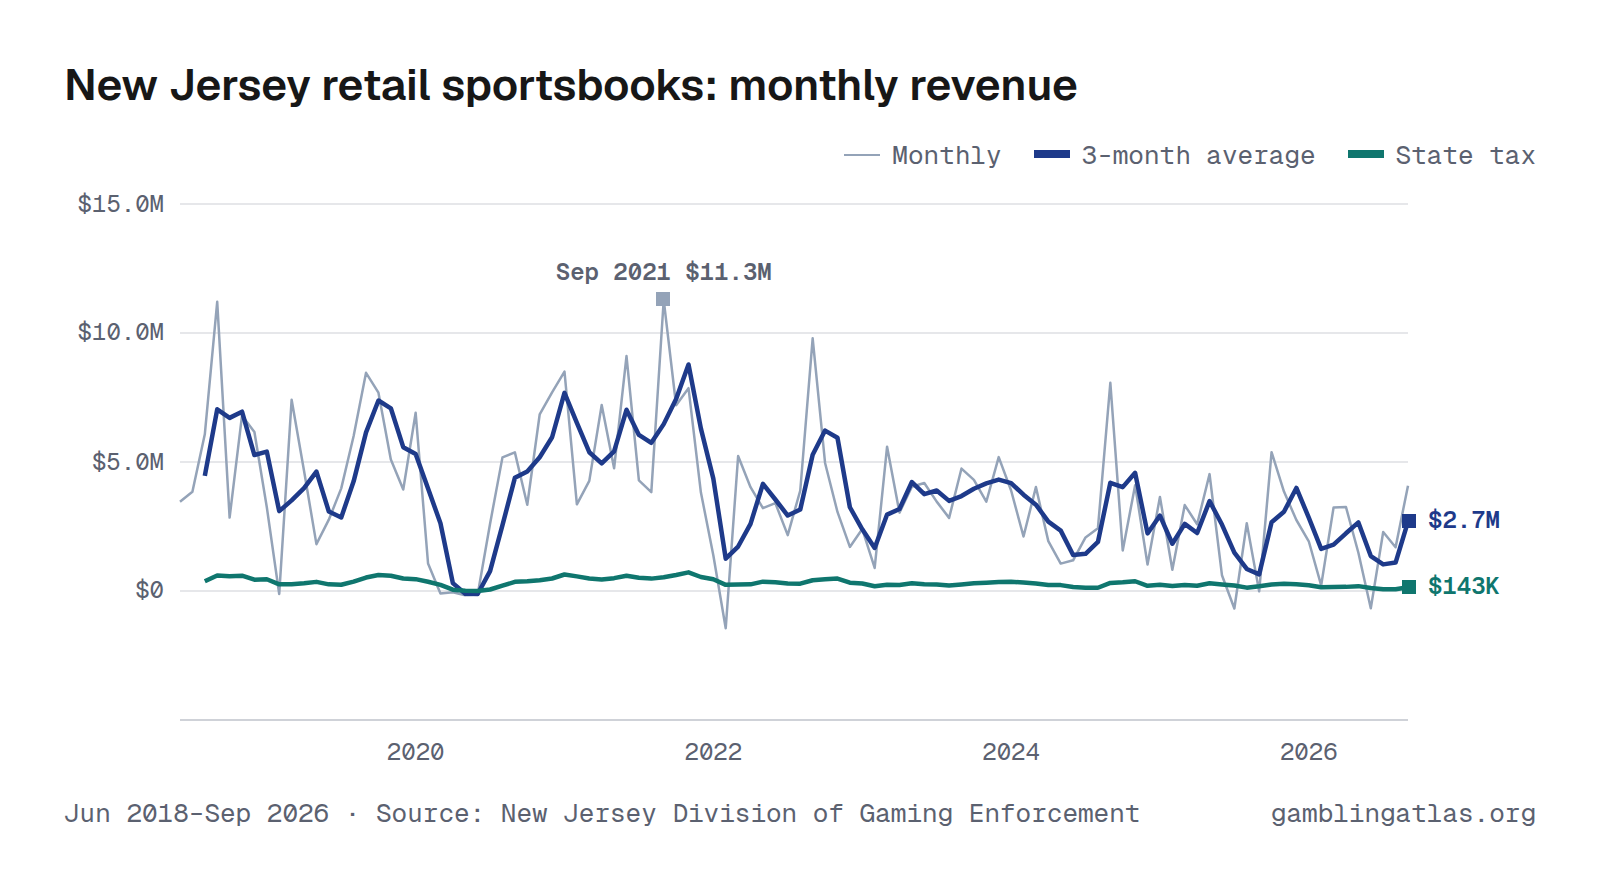
New Jersey retail sportsbooks produced $4.1M in gross gaming revenue in September 2026. Over the 12 months through Sep 2026, revenue totaled $29.5M, and the state collected $2.0M in tax. In the shared comparison window Sep 2025–Aug 2026, it ranked 7th largest of 25 states with monthly retail sports betting revenue.
The highest month on record here is Sep 2021 ($11.3M). Monthly figures run from Jun 2018 to Sep 2026 and come from the New Jersey Division of Gaming Enforcement.
Jun 2018–Sep 2026 · Source: New Jersey Division of Gaming Enforcement · New Jersey revenue
Handle (amount bet)
Download, embed or cite
Free to reuse with a link to this page. License and sources
Data
| Month | Handle | Revenue (GGR) | Hold | State tax |
|---|---|---|---|---|
| Sep 2026 | $4.1M | $249K | ||
| Aug 2026 | $1.7M | $134K | ||
| Jul 2026 | $2.3M | $46.7K | ||
| Jun 2026 | $25.3M | −$673K | -2.7% | $16.6K |
| May 2026 | $29.6M | $1.5M | 5.0% | $131K |
| Apr 2026 | $28.7M | $3.3M | 11.3% | $200K |
| Mar 2026 | $32.4M | $3.2M | 10.0% | $236K |
| Feb 2026 | $25.1M | $216K | 0.9% | $46.1K |
| Jan 2026 | $35.2M | $1.9M | 5.5% | $188K |
| Dec 2025 | $33.6M | $2.8M | 8.2% | $206K |
| Nov 2025 | $60.5M | $3.9M | 6.4% | $276K |
| Oct 2025 | $43.8M | $5.4M | 12.3% | $292K |
| Sep 2025 | $60.1M | −$13.2K | -0.0% | $269K |
| Aug 2025 | $35.5M | $2.6M | 7.4% | $204K |
| Jul 2025 | $33.1M | −$680K | -2.1% | $86.2K |
| Jun 2025 | $35.4M | $613K | 1.7% | $97.3K |
| May 2025 | $43.5M | $4.5M | 10.4% | $454K |
| Apr 2025 | $40.4M | $2.6M | 6.4% | $212K |
| Mar 2025 | $44.4M | $3.3M | 7.5% | $241K |
| Feb 2025 | $39.3M | $825K | 2.1% | $161K |
| Jan 2025 | $46.0M | $3.6M | 7.9% | $307K |
| Dec 2024 | $52.4M | $1.0M | 2.0% | $116K |
| Nov 2024 | $53.1M | $4.1M | 7.7% | $294K |
| Oct 2024 | $43.8M | $1.6M | 3.6% | $195K |
| Sep 2024 | $58.5M | $8.1M | 13.8% | $644K |
| Aug 2024 | $32.5M | $2.4M | 7.5% | $176K |
| Jul 2024 | $28.0M | $2.1M | 7.4% | $122K |
| Jun 2024 | $29.5M | $1.2M | 4.0% | $79.0K |
| May 2024 | $37.5M | $1.1M | 2.8% | $164K |
| Apr 2024 | $34.7M | $1.9M | 5.6% | $217K |
| Mar 2024 | $43.8M | $4.0M | 9.2% | $302K |
| Feb 2024 | $37.9M | $2.1M | 5.6% | $178K |
| Jan 2024 | $47.6M | $3.9M | 8.2% | $386K |
| Dec 2023 | $50.5M | $5.2M | 10.3% | $425K |
| Nov 2023 | $55.3M | $3.5M | 6.3% | $258K |
| Oct 2023 | $56.3M | $4.3M | 7.6% | $356K |
| Sep 2023 | $43.5M | $4.7M | 10.9% | $343K |
| Aug 2023 | $28.8M | $2.8M | 9.8% | $204K |
| Jul 2023 | $25.4M | $3.5M | 13.6% | $217K |
| Jun 2023 | $32.5M | $4.2M | 12.9% | $228K |
| May 2023 | $37.8M | $4.0M | 10.7% | $319K |
| Apr 2023 | $35.5M | $3.0M | 8.6% | $231K |
| Mar 2023 | $50.6M | $5.6M | 11.1% | $362K |
| Feb 2023 | $46.0M | $895K | 1.9% | $114K |
| Jan 2023 | $65.9M | $2.4M | 3.6% | $259K |
| Dec 2022 | $57.2M | $1.7M | 3.0% | $179K |
| Nov 2022 | $69.0M | $3.1M | 4.4% | $428K |
| Oct 2022 | $72.6M | $5.0M | 6.8% | $360K |
| Sep 2022 | $58.9M | $9.8M | 16.6% | $658K |
| Aug 2022 | $37.6M | $3.9M | 10.4% | $343K |
| Jul 2022 | $37.0M | $2.2M | 5.8% | $252K |
| Jun 2022 | $44.3M | $3.4M | 7.7% | $255K |
| May 2022 | $58.0M | $3.2M | 5.5% | $378K |
| Apr 2022 | $63.8M | $4.0M | 6.3% | $377K |
| Mar 2022 | $79.5M | $5.2M | 6.6% | $330K |
| Feb 2022 | $85.9M | −$1.4M | -1.7% | $65.3K |
| Jan 2022 | $139M | $1.4M | 1.0% | $350K |
| Dec 2021 | $119M | $3.8M | 3.2% | $300K |
| Nov 2021 | $114M | $7.9M | 6.9% | $711K |
| Oct 2021 | $124M | $7.2M | 5.8% | $618K |
| Sep 2021 | $92.7M | $11.3M | 12.2% | $835K |
| Aug 2021 | $51.8M | $3.8M | 7.4% | $407K |
| Jul 2021 | $49.3M | $4.3M | 8.7% | $352K |
| Jun 2021 | $83.9M | $9.1M | 10.9% | $682K |
| May 2021 | $79.6M | $4.8M | 6.0% | $505K |
| Apr 2021 | $66.8M | $7.2M | 10.8% | $594K |
| Mar 2021 | $79.5M | $4.3M | 5.4% | $395K |
| Feb 2021 | $53.7M | $3.4M | 6.3% | $340K |
| Jan 2021 | $72.1M | $8.5M | 11.8% | $720K |
| Dec 2020 | $67.0M | $7.7M | 11.5% | $639K |
| Nov 2020 | $59.5M | $6.8M | 11.5% | $562K |
| Oct 2020 | $59.2M | $3.3M | 5.6% | $249K |
| Sep 2020 | $69.8M | $5.4M | 7.7% | $442K |
| Aug 2020 | $66.0M | $5.2M | 7.8% | $446K |
| Jul 2020 | $19.3M | $2.6M | 13.5% | $171K |
| Jun 2020 | $146M | −$134K | -0.1% | $0 |
| May 2020 | $146M | −$165K | -0.1% | $0 |
| Apr 2020 | $146M | −$47.8K | -0.0% | $0 |
| Mar 2020 | $18.5M | −$98.1K | -0.5% | $23.4K |
| Feb 2020 | $58.3M | $1.1M | 1.8% | $134K |
| Jan 2020 | $69.0M | $6.9M | 10.0% | $559K |
| Dec 2019 | $68.9M | $3.9M | 5.7% | $388K |
| Nov 2019 | $75.9M | $5.1M | 6.7% | $431K |
| Oct 2019 | $71.0M | $7.7M | 10.8% | $631K |
| Sep 2019 | $71.3M | $8.5M | 11.9% | $712K |
| Aug 2019 | $44.4M | $6.0M | 13.5% | $511K |
| Jul 2019 | $38.3M | $4.0M | 10.4% | $343K |
| Jun 2019 | $46.5M | $2.8M | 5.9% | $234K |
| May 2019 | $55.4M | $1.8M | 3.3% | $148K |
| Apr 2019 | $59.7M | $4.7M | 7.8% | $391K |
| Mar 2019 | $74.2M | $7.4M | 10.0% | $522K |
| Feb 2019 | $61.5M | −$119K | -0.2% | −$6,162 |
| Jan 2019 | $80.3M | $3.2M | 4.0% | $271K |
| Dec 2018 | $78.1M | $6.2M | 7.9% | $511K |
| Nov 2018 | $92.1M | $6.8M | 7.4% | $578K |
| Oct 2018 | $86.3M | $2.8M | 3.3% | $227K |
| Sep 2018 | $79.1M | $11.2M | 14.2% | $970K |
| Aug 2018 | $73.9M | $6.1M | 8.2% | $516K |
| Jul 2018 | $3.8M | $329K | ||
| Jun 2018 | $3.5M | $294K |
| Year | Handle | Revenue (GGR) | State tax |
|---|---|---|---|
| 2026 | $176M (6 mo) | $17.5M (9 mo) | $1.2M (9 mo) |
| 2025 | $515M | $29.5M | $2.8M |
| 2024 | $499M | $33.5M | $2.9M |
| 2023 | $528M | $44.1M | $3.3M |
| 2022 | $803M | $41.4M | $4.0M |
| 2021 | $987M | $75.5M | $6.5M |
| 2020 | $924M | $38.6M | $3.2M |
| 2019 | $747M | $54.9M | $4.6M |
| 2018 | $410M (5 mo) | $40.4M (7 mo) | $3.4M (7 mo) |
Years with missing months show partial totals, marked with the number of months reported.
| Operator | GGR |
|---|---|
| New Meadowlands Racetrack | $14.7M |
| Borgata | $5.1M |
| Darby Development | $2.6M |
| Hard Rock Digital | $2.5M |
| Caesars Entertainment | $2.4M |
| Ocean Casino Resort | $1.3M |
| Golden Nugget | $618K |
| Bally's Corporation | $295K |
| Mohegan | $57.9K |
License-holder totals may include partner-operated brands.
Notes
GGR is the return's "Monthly Retail Sports Wagering Gross Revenue" line. Tax paid is the return's "Total Retail Sports Wagering Tax Payment for this Month" line.
Sources
- NJ DGE-107 Sports Wagering Tax Return June
- NJ DGE-107 Sports Wagering Tax Return March
- NJ DGE-107 Sports Wagering Tax Return May
- NJ DGE-107 Sports Wagering Tax Return November
- NJ DGE-107 Sports Wagering Tax Return October
- NJ DGE-107 Sports Wagering Tax Return September
Related charts
Same chart for other states
Colorado · Connecticut · Delaware · District of Columbia · Illinois · Indiana · Iowa · Kansas · Kentucky · Louisiana · Maine · Maryland · Massachusetts · Michigan · Mississippi · Nebraska · Nevada · New Hampshire · New York · Ohio · Pennsylvania · Rhode Island · South Dakota · West Virginia