States / New Hampshire / Chart
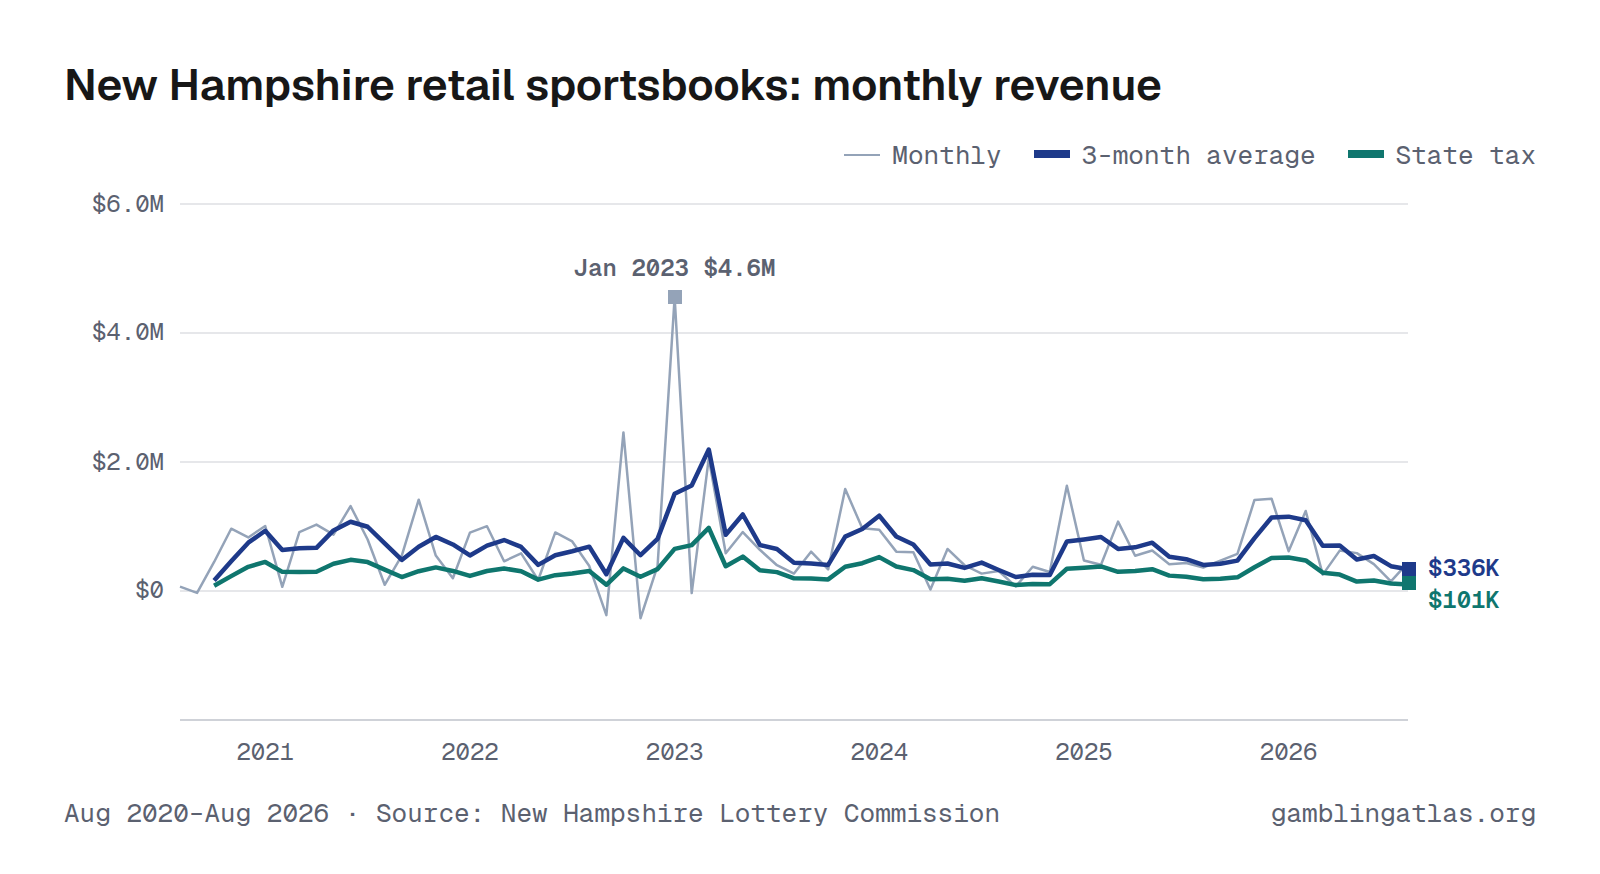
New Hampshire Retail Sports Betting Revenue and Handle by Month
New Hampshire retail sportsbooks produced $440K in gross gaming revenue in August 2026, up 21% from Aug 2025. Over the 12 months through Aug 2026, revenue totaled $8.2M on $74.5M in bets, a 11.0% hold, and the state collected $3.3M in tax. In the shared comparison window Sep 2025–Aug 2026, it ranked 17th largest of 25 states with monthly retail sports betting revenue.
The highest month on record here is Jan 2023 ($4.6M). Monthly figures run from Aug 2020 to Aug 2026 and come from the New Hampshire Lottery Commission.
Aug 2020–Aug 2026 · Source: New Hampshire Lottery Commission · New Hampshire revenue
Handle (amount bet)
Download, embed or cite
Free to reuse with a link to this page. License and sources
Data
| Month | Handle | Revenue (GGR) | Hold | State tax |
|---|---|---|---|---|
| Aug 2026 | $4.2M | $440K | 10.4% | $132K |
| Jul 2026 | $4.3M | $151K | 3.5% | $45.2K |
| Jun 2026 | $3.8M | $416K | 10.9% | $125K |
| May 2026 | $4.0M | $587K | 14.8% | $176K |
| Apr 2026 | $4.2M | $626K | 14.9% | $188K |
| Mar 2026 | $4.6M | $254K | 5.5% | $76.1K |
| Feb 2026 | $5.1M | $1.2M | 24.4% | $499K |
| Jan 2026 | $8.8M | $617K | 7.0% | $278K |
| Dec 2025 | $10.1M | $1.4M | 14.2% | $644K |
| Nov 2025 | $9.4M | $1.4M | 15.0% | $635K |
| Oct 2025 | $9.3M | $577K | 6.2% | $259K |
| Sep 2025 | $6.8M | $472K | 7.0% | $212K |
| Aug 2025 | $3.3M | $364K | 10.9% | $164K |
| Jul 2025 | $3.2M | $435K | 13.6% | $196K |
| Jun 2025 | $3.4M | $416K | 12.4% | $187K |
| May 2025 | $5.1M | $627K | 12.4% | $282K |
| Apr 2025 | $5.5M | $547K | 10.0% | $246K |
| Mar 2025 | $7.1M | $1.1M | 15.1% | $484K |
| Feb 2025 | $4.4M | $408K | 9.3% | $196K |
| Jan 2025 | $7.2M | $472K | 6.6% | $213K |
| Dec 2024 | $9.2M | $1.6M | 17.6% | $734K |
| Nov 2024 | $12.2M | $295K | 2.4% | $132K |
| Oct 2024 | $9.8M | $375K | 3.8% | $169K |
| Sep 2024 | $8.4M | $72.0K | 0.9% | $15.5K |
| Aug 2024 | $3.6M | $310K | 8.6% | $139K |
| Jul 2024 | $2.9M | $269K | 9.2% | $120K |
| Jun 2024 | $4.8M | $399K | 8.3% | $180K |
| May 2024 | $6.3M | $652K | 10.3% | $294K |
| Apr 2024 | $6.3M | $23.2K | 0.4% | $2,037 |
| Mar 2024 | $7.6M | $601K | 7.9% | $270K |
| Feb 2024 | $6.4M | $611K | 9.5% | $275K |
| Jan 2024 | $10.6M | $951K | 9.0% | $428K |
| Dec 2023 | $11.7M | $972K | 8.3% | $437K |
| Nov 2023 | $10.6M | $1.6M | 14.9% | $712K |
| Oct 2023 | $12.0M | $334K | 2.8% | $145K |
| Sep 2023 | $7.7M | $610K | 8.0% | $274K |
| Aug 2023 | $4.0M | $270K | 6.8% | $122K |
| Jul 2023 | $3.5M | $400K | 11.4% | $180K |
| Jun 2023 | $4.5M | $639K | 14.1% | $288K |
| May 2023 | $5.7M | $914K | 16.0% | $411K |
| Apr 2023 | $8.3M | $587K | 7.1% | $264K |
| Mar 2023 | $10.0M | $2.1M | 20.6% | $926K |
| Feb 2023 | $11.5M | −$31.9K | -0.3% | −$41.3K |
| Jan 2023 | $21.9M | $4.6M | 20.8% | $2.0M |
| Dec 2022 | $25.0M | $390K | 1.6% | $127K |
| Nov 2022 | $24.0M | −$422K | -1.8% | −$215K |
| Oct 2022 | $23.1M | $2.5M | 10.6% | $1.1M |
| Sep 2022 | $19.8M | −$374K | -1.9% | −$229K |
| Aug 2022 | $10.5M | $386K | 3.7% | $174K |
| Jul 2022 | $9.5M | $768K | 8.0% | $346K |
| Jun 2022 | $12.0M | $908K | 7.6% | $409K |
| May 2022 | $15.3M | $171K | 1.1% | $65.2K |
| Apr 2022 | $12.7M | $584K | 4.6% | $262K |
| Mar 2022 | $18.5M | $460K | 2.5% | $200K |
| Feb 2022 | $11.8M | $1.0M | 8.5% | $452K |
| Jan 2022 | $18.0M | $906K | 5.0% | $396K |
| Dec 2021 | $20.9M | $199K | 1.0% | $82.4K |
| Nov 2021 | $20.8M | $550K | 2.6% | $222K |
| Oct 2021 | $30.1M | $1.4M | 4.7% | $628K |
| Sep 2021 | $17.7M | $549K | 3.1% | $248K |
| Aug 2021 | $6.8M | $95.9K | 1.4% | $43.2K |
| Jul 2021 | $6.4M | $798K | 12.6% | $359K |
| Jun 2021 | $8.2M | $1.3M | 16.1% | $592K |
| May 2021 | $9.1M | $874K | 9.6% | $393K |
| Apr 2021 | $9.3M | $1.0M | 11.1% | $463K |
| Mar 2021 | $11.4M | $913K | 8.0% | $411K |
| Feb 2021 | $8.0M | $65.0K | 0.8% | $22.5K |
| Jan 2021 | $10.4M | $1.0M | 9.7% | $453K |
| Dec 2020 | $8.0M | $831K | 10.4% | $415K |
| Nov 2020 | $7.6M | $965K | 12.6% | $483K |
| Oct 2020 | $6.8M | $450K | 6.6% | $225K |
| Sep 2020 | $4.8M | −$29.9K | -0.6% | −$15.0K |
| Aug 2020 | $1.1M | $67.5K | 6.1% | $33.8K |
| Year | Handle | Revenue (GGR) | State tax |
|---|---|---|---|
| 2026 | $39.0M (8 mo) | $4.3M (8 mo) | $1.5M (8 mo) |
| 2025 | $74.7M | $8.2M | $3.7M |
| 2024 | $88.3M | $6.2M | $2.8M |
| 2023 | $111M | $12.9M | $5.8M |
| 2022 | $200M | $7.2M | $3.1M |
| 2021 | $159M | $8.8M | $3.9M |
| 2020 | $28.4M (5 mo) | $2.3M (5 mo) | $1.1M (5 mo) |
Years with missing months show partial totals, marked with the number of months reported.
| Operator | Handle | GGR |
|---|---|---|
| DraftKings | $74.5M | $8.2M |
License-holder totals may include partner-operated brands.
Notes
GGR is retail sports wagering gross gaming revenue. Tax paid is the Lottery's printed state revenue share under its contract with DraftKings (the state's share under a lottery-run model, not a tax).
Sources
Related charts
Same chart for other states
Colorado · Connecticut · Delaware · District of Columbia · Illinois · Indiana · Iowa · Kansas · Kentucky · Louisiana · Maine · Maryland · Massachusetts · Michigan · Mississippi · Nebraska · Nevada · New Jersey · New York · Ohio · Pennsylvania · Rhode Island · South Dakota · West Virginia