Delaware Retail Sports Betting Revenue and Handle by Month
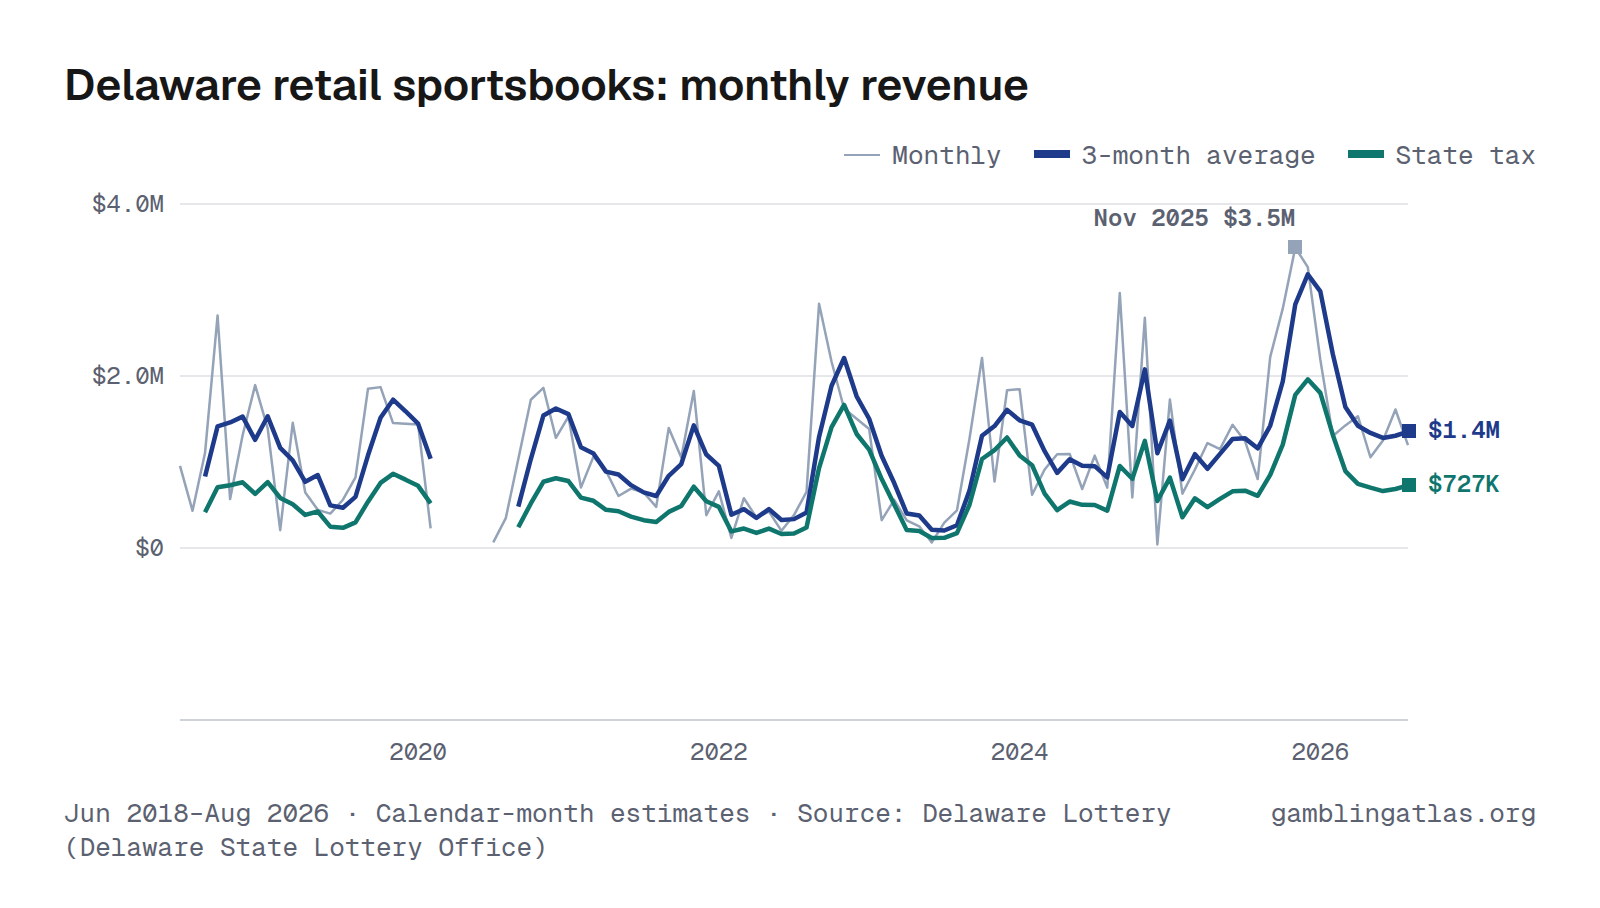
Delaware retail sportsbooks produced $1.2M in gross gaming revenue in August 2026, up 49% from Aug 2025. Over the 12 months through Aug 2026, revenue totaled $23.3M on $261M in bets, a 8.9% hold, and the state collected $13.6M in tax. In the shared comparison window Sep 2025–Aug 2026, it ranked 9th largest of 25 states with monthly retail sports betting revenue.
The highest month on record here is Nov 2025 ($3.5M). Monthly figures run from Jun 2018 to Aug 2026 and come from the Delaware Lottery (Delaware State Lottery Office).
Reports spanning calendar months are allocated evenly across their days; monthly values are estimates. Months without complete reporting coverage are omitted.
Jun 2018–Aug 2026 · Calendar-month estimates · Source: Delaware Lottery (Delaware State Lottery Office) · Delaware revenue
Handle (amount bet)
Download, embed or cite
Free to reuse with a link to this page. License and sources
Data
| Month | Handle | Revenue (GGR) | Hold | State tax |
|---|---|---|---|---|
| Aug 2026 | $15.6M | $1.2M | 7.7% | $672K |
| Jul 2026 | $21.6M | $1.6M | 7.5% | $862K |
| Jun 2026 | $18.6M | $1.3M | 6.7% | $649K |
| May 2026 | $16.1M | $1.1M | 6.6% | $548K |
| Apr 2026 | $18.3M | $1.5M | 8.4% | $789K |
| Mar 2026 | $17.2M | $1.4M | 8.3% | $767K |
| Feb 2026 | $16.6M | $1.3M | 7.8% | $679K |
| Jan 2026 | $23.5M | $2.2M | 9.3% | $1.2M |
| Dec 2025 | $26.1M | $3.3M | 12.5% | $2.0M |
| Nov 2025 | $26.8M | $3.5M | 13.0% | $2.1M |
| Oct 2025 | $30.8M | $2.8M | 9.0% | $1.7M |
| Sep 2025 | $29.6M | $2.2M | 7.5% | $1.5M |
| Aug 2025 | $13.8M | $802K | 5.8% | $414K |
| Jul 2025 | $15.0M | $1.2M | 8.3% | $657K |
| Jun 2025 | $14.4M | $1.4M | 9.9% | $749K |
| May 2025 | $17.5M | $1.2M | 6.6% | $593K |
| Apr 2025 | $18.2M | $1.2M | 6.7% | $634K |
| Mar 2025 | $21.6M | $913K | 4.2% | $485K |
| Feb 2025 | $18.1M | $632K | 3.5% | $303K |
| Jan 2025 | $23.8M | $1.7M | 7.3% | $944K |
| Dec 2024 | $28.4M | $41.2K | 0.1% | −$175K |
| Nov 2024 | $26.4M | $2.7M | 10.1% | $1.7M |
| Oct 2024 | $23.0M | $588K | 2.6% | $128K |
| Sep 2024 | $23.2M | $3.0M | 12.8% | $1.9M |
| Aug 2024 | $10.3M | $702K | 6.8% | $365K |
| Jul 2024 | $9.9M | $1.1M | 10.8% | $574K |
| Jun 2024 | $11.2M | $686K | 6.1% | $363K |
| May 2024 | $15.9M | $1.1M | 6.9% | $563K |
| Apr 2024 | $16.6M | $1.1M | 6.6% | $581K |
| Mar 2024 | $16.8M | $912K | 5.4% | $477K |
| Feb 2024 | $14.5M | $618K | 4.3% | $265K |
| Jan 2024 | $18.6M | $1.8M | 10.0% | $1.2M |
| Dec 2023 | $7.8M | $1.8M | 23.4% | $1.5M |
| Nov 2023 | $8.6M | $772K | 9.0% | $609K |
| Oct 2023 | $9.4M | $2.2M | 23.5% | $1.8M |
| Sep 2023 | $8.4M | $1.3M | 15.2% | $1.0M |
| Aug 2023 | $3.4M | $437K | 12.8% | $302K |
| Jul 2023 | $2.3M | $294K | 12.6% | $183K |
| Jun 2023 | $2.8M | $64.6K | 2.3% | $34.8K |
| May 2023 | $3.0M | $252K | 8.3% | $139K |
| Apr 2023 | $3.0M | $321K | 10.9% | $174K |
| Mar 2023 | $3.7M | $559K | 15.0% | $281K |
| Feb 2023 | $4.1M | $324K | 7.9% | $168K |
| Jan 2023 | $7.3M | $1.4M | 18.9% | $1.1M |
| Dec 2022 | $8.7M | $1.5M | 17.2% | $1.2M |
| Nov 2022 | $10.7M | $1.6M | 15.2% | $1.2M |
| Oct 2022 | $12.0M | $2.2M | 18.1% | $1.6M |
| Sep 2022 | $9.9M | $2.8M | 28.6% | $2.2M |
| Aug 2022 | $3.9M | $653K | 16.9% | $421K |
| Jul 2022 | $2.7M | $383K | 14.3% | $191K |
| Jun 2022 | $199K | $99.7K | ||
| May 2022 | $424K | $212K | ||
| Apr 2022 | $354K | $177K | ||
| Mar 2022 | $579K | $289K | ||
| Feb 2022 | $118K | $59.0K | ||
| Jan 2022 | $659K | $329K | ||
| Dec 2021 | $382K | $191K | ||
| Nov 2021 | $1.8M | $913K | ||
| Oct 2021 | $1.1M | $526K | ||
| Sep 2021 | $1.4M | $698K | ||
| Aug 2021 | $478K | $239K | ||
| Jul 2021 | $645K | $323K | ||
| Jun 2021 | $691K | $345K | ||
| May 2021 | $605K | $302K | ||
| Apr 2021 | $896K | $448K | ||
| Mar 2021 | $1.1M | $531K | ||
| Feb 2021 | $704K | $352K | ||
| Jan 2021 | $1.5M | $764K | ||
| Dec 2020 | $1.3M | $640K | ||
| Nov 2020 | $1.9M | $931K | ||
| Oct 2020 | $1.7M | $862K | ||
| Sep 2020 | $1.0M | $517K | ||
| Aug 2020 | $347K | $173K | ||
| Jul 2020 | $64.6K | $32.3K | ||
| Feb 2020 | $229K | $115K | ||
| Jan 2020 | $1.4M | $719K | ||
| Dec 2019 | $1.4M | $722K | ||
| Nov 2019 | $1.5M | $726K | ||
| Oct 2019 | $1.9M | $935K | ||
| Sep 2019 | $1.9M | $926K | ||
| Aug 2019 | $821K | $411K | ||
| Jul 2019 | $562K | $281K | ||
| Jun 2019 | $400K | $200K | ||
| May 2019 | $444K | $222K | ||
| Apr 2019 | $645K | $322K | ||
| Mar 2019 | $1.5M | $728K | ||
| Feb 2019 | $207K | $103K | ||
| Jan 2019 | $1.4M | $695K | ||
| Dec 2018 | $1.9M | $947K | ||
| Nov 2018 | $1.3M | $656K | ||
| Oct 2018 | $569K | $285K | ||
| Sep 2018 | $2.7M | $1.4M | ||
| Aug 2018 | $1.1M | $553K | ||
| Jul 2018 | $433K | $216K | ||
| Jun 2018 | $954K | $477K |
| Year | Handle | Revenue (GGR) | State tax |
|---|---|---|---|
| 2026 | $147M (8 mo) | $11.6M (8 mo) | $6.2M (8 mo) |
| 2025 | $256M | $20.9M | $12.1M |
| 2024 | $215M | $14.3M | $7.9M |
| 2023 | $63.9M | $9.7M | $7.2M |
| 2022 | $47.9M (6 mo) | $11.5M | $7.9M |
| 2021 | $11.3M | $5.6M | |
| 2020 | $8.0M (8 mo) | $4.0M (8 mo) | |
| 2019 | $12.5M | $6.3M | |
| 2018 | $9.0M (7 mo) | $4.5M (7 mo) |
Years with missing months show partial totals, marked with the number of months reported.
| Operator | Handle | GGR |
|---|---|---|
| Delaware Park Casino & Racing | $172M | $13.4M |
| Retailers (unmatched) | $27.0M | $5.6M |
| Harrington Raceway & Casino | $56.8M | $4.4M |
| Bally's Corporation | $29.0M | $2.5M |
License-holder totals may include partner-operated brands. “(unmatched)” rows show the regulator's reported name with no linked operator record here — that can be an operator not yet matched, or a non-operator reporting channel (e.g. a lottery's own retail-location sales) rather than a licensed sportsbook or casino.
Notes
GGR is the Lottery's "Net Proceeds" line for sportsbooks. Tax paid is the Lottery's "State Share" line for sportsbooks (the state's share under a lottery-run model, not a tax). Delaware sports wagering is run by the Lottery, and online betting is not reported apart from retail. From FY2023 (periods starting 2022-07 on), the printed "Total"/"_total" row blends two differently-taxed products: the 3 racino sportsbooks (50% state share, 29 Del. C. § 4815(c)(1)) and the Lottery's own licensed-retail "Sports Pick" locations ("Retailers", § 4815(c)(2)), whose effective state share is empirically much higher (observed around 90% of its own net proceeds, from the Lottery's own printed figures, not a statutory rate). Retailers is absent from every period before 2022-07 (pre-FY2023 pages have only the 3 racino columns), so the combined hold, GGR, and effective-tax-rate figures are not comparable before vs. after that date, and will run well above 50% state share as Retailers' share of the mix grows.
Sources
- DE Lottery Sportsbooks Monthly Distribution
- DE Lottery Sportsbooks Monthly Proceeds FY2023
- DE Lottery Sportsbooks Monthly Proceeds FY2024
- DE Lottery Sportsbooks Monthly Proceeds FY2025
- DE Lottery Sportsbooks Monthly Proceeds FY2026
- DE Lottery Sportsbooks Monthly Proceeds FY2027
Related charts
Same chart for other states
Colorado · Connecticut · District of Columbia · Illinois · Indiana · Iowa · Kansas · Kentucky · Louisiana · Maine · Maryland · Massachusetts · Michigan · Mississippi · Nebraska · Nevada · New Hampshire · New Jersey · New York · Ohio · Pennsylvania · Rhode Island · South Dakota · West Virginia