States / West Virginia / Chart
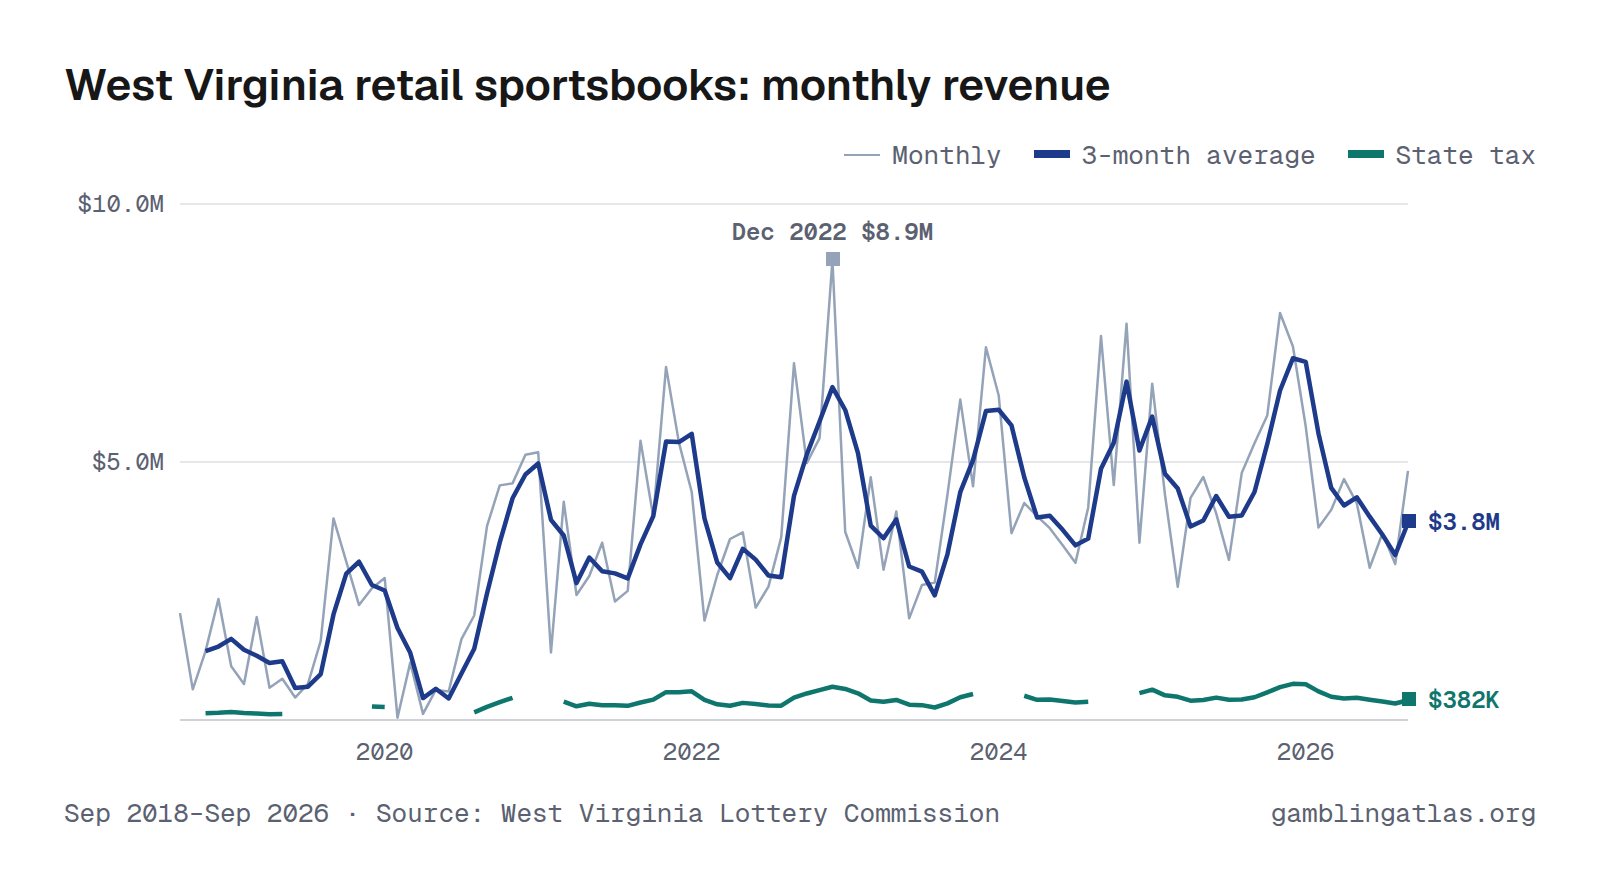
West Virginia Retail Sports Betting Revenue by Month
West Virginia retail sportsbooks produced $4.8M in gross gaming revenue in September 2026, down 10% from Sep 2025. Over the 12 months through Sep 2026, revenue totaled $57.8M, and the state collected $5.8M in tax. In the shared comparison window Sep 2025–Aug 2026, it ranked 3rd largest of 25 states with monthly retail sports betting revenue.
The highest month on record here is Dec 2022 ($8.9M). Monthly figures run from Sep 2018 to Sep 2026 and come from the West Virginia Lottery Commission.
Sep 2018–Sep 2026 · Source: West Virginia Lottery Commission · West Virginia revenue
Download, embed or cite
Free to reuse with a link to this page. License and sources
Data
| Month | Revenue (GGR) | State tax |
|---|---|---|
| Sep 2026 | $4.8M | $483K |
| Aug 2026 | $3.0M | $302K |
| Jul 2026 | $3.6M | $362K |
| Jun 2026 | $3.0M | $295K |
| May 2026 | $4.2M | $420K |
| Apr 2026 | $4.7M | $467K |
| Mar 2026 | $4.1M | $407K |
| Feb 2026 | $3.7M | $373K |
| Jan 2026 | $5.7M | $569K |
| Dec 2025 | $7.2M | $724K |
| Nov 2025 | $7.9M | $789K |
| Oct 2025 | $5.9M | $590K |
| Sep 2025 | $5.4M | $536K |
| Aug 2025 | $4.8M | $478K |
| Jul 2025 | $3.1M | $310K |
| Jun 2025 | $4.0M | $400K |
| May 2025 | $4.7M | $471K |
| Apr 2025 | $4.3M | $431K |
| Mar 2025 | $2.6M | $258K |
| Feb 2025 | $4.4M | $437K |
| Jan 2025 | $6.5M | $653K |
| Dec 2024 | $3.4M | $344K |
| Nov 2024 | $7.7M | $768K |
| Oct 2024 | $4.6M | $455K |
| Sep 2024 | $7.4M | |
| Aug 2024 | $4.1M | $412K |
| Jul 2024 | $3.0M | $305K |
| Jun 2024 | $3.4M | $339K |
| May 2024 | $3.7M | $372K |
| Apr 2024 | $4.0M | $395K |
| Mar 2024 | $4.2M | $420K |
| Feb 2024 | $3.6M | $362K |
| Jan 2024 | $6.3M | $629K |
| Dec 2023 | $7.2M | |
| Nov 2023 | $4.5M | $453K |
| Oct 2023 | $6.2M | $621K |
| Sep 2023 | $4.4M | $437K |
| Aug 2023 | $2.7M | $266K |
| Jul 2023 | $2.6M | $262K |
| Jun 2023 | $2.0M | $197K |
| May 2023 | $4.0M | $404K |
| Apr 2023 | $2.9M | $291K |
| Mar 2023 | $4.7M | $470K |
| Feb 2023 | $3.0M | $295K |
| Jan 2023 | $3.6M | $365K |
| Dec 2022 | $8.9M | $891K |
| Nov 2022 | $5.5M | $546K |
| Oct 2022 | $5.0M | $498K |
| Sep 2022 | $6.9M | $691K |
| Aug 2022 | $3.5M | $354K |
| Jul 2022 | $2.6M | $258K |
| Jun 2022 | $2.2M | $218K |
| May 2022 | $3.6M | $364K |
| Apr 2022 | $3.5M | $351K |
| Mar 2022 | $2.8M | $281K |
| Feb 2022 | $1.9M | $193K |
| Jan 2022 | $4.4M | $442K |
| Dec 2021 | $5.4M | $538K |
| Nov 2021 | $6.8M | $684K |
| Oct 2021 | $3.9M | $394K |
| Sep 2021 | $5.4M | $541K |
| Aug 2021 | $2.5M | $250K |
| Jul 2021 | $2.3M | $230K |
| Jun 2021 | $3.4M | $344K |
| May 2021 | $2.8M | $279K |
| Apr 2021 | $2.4M | $242K |
| Mar 2021 | $4.2M | $423K |
| Feb 2021 | $1.3M | $131K |
| Jan 2021 | $5.2M | $519K |
| Dec 2020 | $5.1M | |
| Nov 2020 | $4.6M | $459K |
| Oct 2020 | $4.5M | $455K |
| Sep 2020 | $3.8M | $376K |
| Aug 2020 | $2.0M | $203K |
| Jul 2020 | $1.6M | $187K |
| Jun 2020 | $551K | $55.0K |
| May 2020 | $584K | |
| Apr 2020 | $119K | $12.0K |
| Mar 2020 | $1.1M | $111K |
| Feb 2020 | $44.5K | |
| Jan 2020 | $2.8M | $275K |
| Dec 2019 | $2.6M | $255K |
| Nov 2019 | $2.2M | $223K |
| Oct 2019 | $3.1M | $307K |
| Sep 2019 | $3.9M | |
| Aug 2019 | $1.5M | $153K |
| Jul 2019 | $700K | $70.0K |
| Jun 2019 | $435K | |
| May 2019 | $799K | $80.0K |
| Apr 2019 | $624K | $62.0K |
| Mar 2019 | $2.0M | $199K |
| Feb 2019 | $699K | $70.0K |
| Jan 2019 | $1.0M | $104K |
| Dec 2018 | $2.3M | $234K |
| Nov 2018 | $1.3M | $133K |
| Oct 2018 | $594K | $59.0K |
| Sep 2018 | $2.1M | $207K |
| Year | Revenue (GGR) | State tax |
|---|---|---|
| 2026 | $36.8M (9 mo) | $3.7M (9 mo) |
| 2025 | $60.8M | $6.1M |
| 2024 | $55.4M | $4.8M (11 mo) |
| 2023 | $47.8M | $4.1M (11 mo) |
| 2022 | $50.9M | $5.1M |
| 2021 | $45.7M | $4.6M |
| 2020 | $26.8M | $2.1M (9 mo) |
| 2019 | $19.6M | $1.5M (10 mo) |
| 2018 | $6.3M (4 mo) | $633K (4 mo) |
Years with missing months show partial totals, marked with the number of months reported.
Notes
GGR is adjusted gross wagering receipts, retail and online combined. Tax paid is the 10% sports wagering privilege tax deposited. West Virginia does not split retail from online, so this series is all sports wagering.
Sources
- WV Lottery Monthly Report on Lottery Operations --
- WV Lottery Monthly Report on Lottery Operations -- derived for 2024-09 (not submitted by the agency)
- WV Lottery Monthly Report on Lottery Operations -- derived for 2025-06 (not submitted by the agency)
Related charts
Same chart for other states
Colorado · Connecticut · Delaware · District of Columbia · Illinois · Indiana · Iowa · Kansas · Kentucky · Louisiana · Maine · Maryland · Massachusetts · Michigan · Mississippi · Nebraska · Nevada · New Hampshire · New Jersey · New York · Ohio · Pennsylvania · Rhode Island · South Dakota