States / West Virginia / Chart
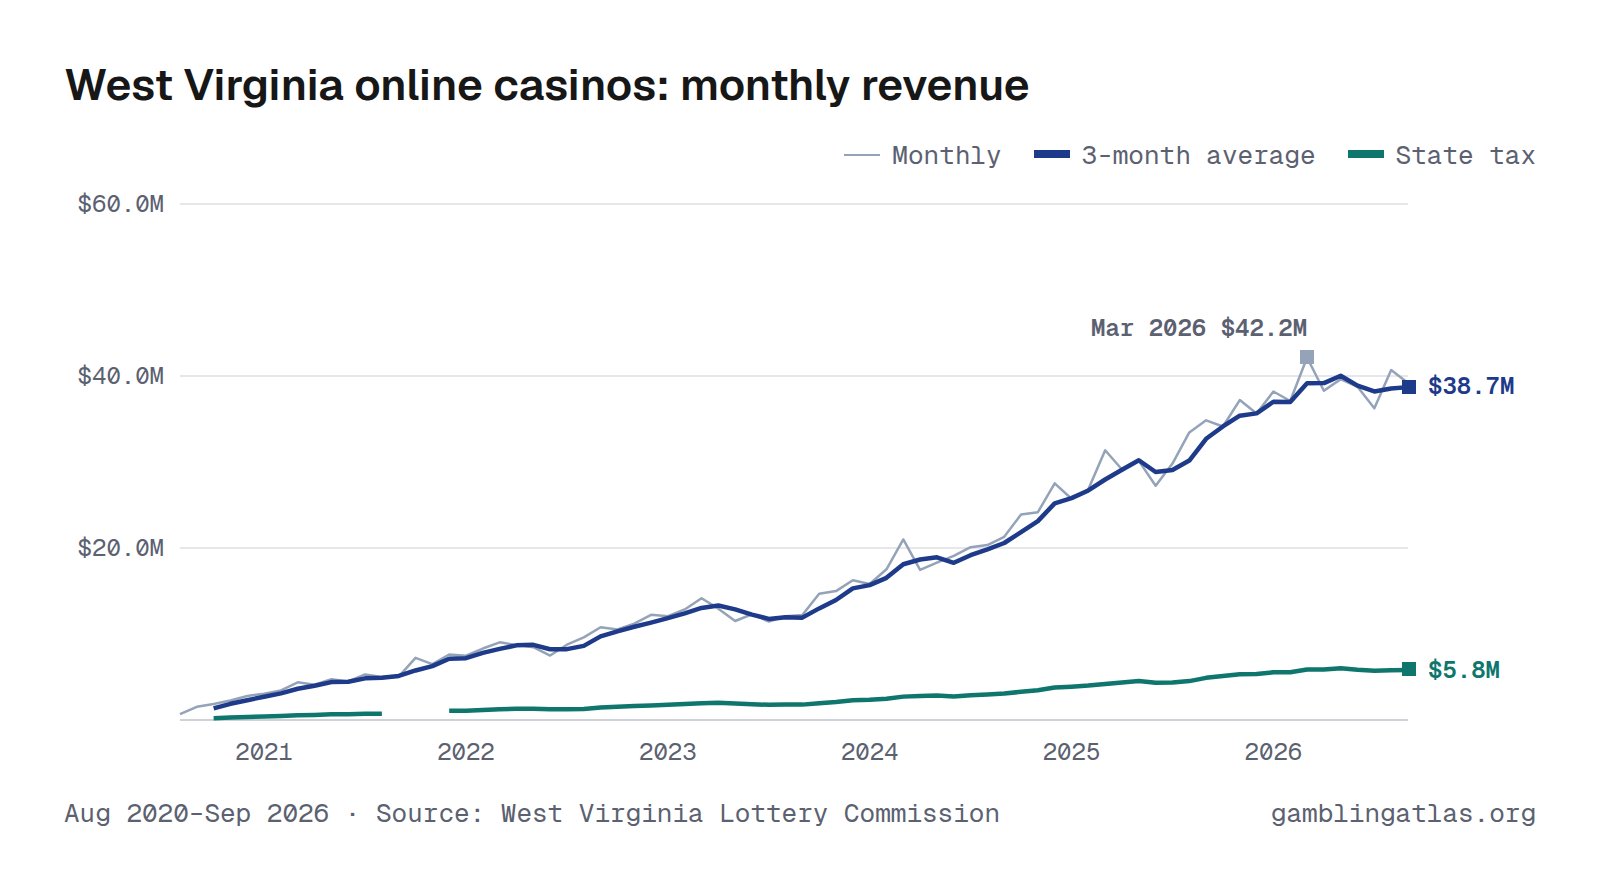
West Virginia Online Casino Revenue by Month
West Virginia online casinos produced $39.2M in gross gaming revenue in September 2026, up 12% from Sep 2025. Over the 12 months through Sep 2026, revenue totaled $457M, and the state collected $68.6M in tax. In the shared comparison window Sep 2025–Aug 2026, it ranked 5th largest of 7 states with monthly online casino revenue.
The highest month on record here is Mar 2026 ($42.2M). Monthly figures run from Aug 2020 to Sep 2026 and come from the West Virginia Lottery Commission.
Aug 2020–Sep 2026 · Source: West Virginia Lottery Commission · West Virginia revenue
Download, embed or cite
Free to reuse with a link to this page. License and sources
Data
| Month | Revenue (GGR) | State tax |
|---|---|---|
| Sep 2026 | $39.2M | $5.9M |
| Aug 2026 | $40.7M | $6.1M |
| Jul 2026 | $36.2M | $5.4M |
| Jun 2026 | $38.7M | $5.8M |
| May 2026 | $39.6M | $5.9M |
| Apr 2026 | $38.3M | $5.7M |
| Mar 2026 | $42.2M | $6.3M |
| Feb 2026 | $37.1M | $5.6M |
| Jan 2026 | $38.2M | $5.7M |
| Dec 2025 | $35.6M | $5.3M |
| Nov 2025 | $37.2M | $5.6M |
| Oct 2025 | $34.1M | $5.1M |
| Sep 2025 | $34.8M | $5.2M |
| Aug 2025 | $33.4M | $5.0M |
| Jul 2025 | $29.8M | $4.5M |
| Jun 2025 | $27.2M | $4.1M |
| May 2025 | $30.1M | $4.5M |
| Apr 2025 | $29.1M | $4.4M |
| Mar 2025 | $31.4M | $4.7M |
| Feb 2025 | $26.8M | $4.0M |
| Jan 2025 | $25.7M | $3.9M |
| Dec 2024 | $27.5M | $4.1M |
| Nov 2024 | $24.2M | $3.6M |
| Oct 2024 | $23.9M | $3.6M |
| Sep 2024 | $21.3M | $3.2M |
| Aug 2024 | $20.3M | $3.1M |
| Jul 2024 | $20.1M | $3.0M |
| Jun 2024 | $19.1M | $2.9M |
| May 2024 | $18.3M | $2.7M |
| Apr 2024 | $17.5M | $2.6M |
| Mar 2024 | $21.0M | $3.1M |
| Feb 2024 | $17.5M | $2.6M |
| Jan 2024 | $15.8M | $2.4M |
| Dec 2023 | $16.3M | $2.4M |
| Nov 2023 | $15.0M | $2.2M |
| Oct 2023 | $14.7M | $2.2M |
| Sep 2023 | $12.2M | $1.8M |
| Aug 2023 | $12.1M | $1.8M |
| Jul 2023 | $11.5M | $1.7M |
| Jun 2023 | $12.3M | $1.8M |
| May 2023 | $11.5M | $1.7M |
| Apr 2023 | $12.9M | $1.9M |
| Mar 2023 | $14.2M | $2.1M |
| Feb 2023 | $12.9M | $1.9M |
| Jan 2023 | $12.1M | $1.8M |
| Dec 2022 | $12.2M | $1.8M |
| Nov 2022 | $11.2M | $1.7M |
| Oct 2022 | $10.5M | $1.6M |
| Sep 2022 | $10.8M | $1.6M |
| Aug 2022 | $9.6M | $1.4M |
| Jul 2022 | $8.8M | $1.3M |
| Jun 2022 | $7.5M | $1.1M |
| May 2022 | $8.5M | $1.3M |
| Apr 2022 | $8.7M | $1.3M |
| Mar 2022 | $9.0M | $1.4M |
| Feb 2022 | $8.3M | $1.2M |
| Jan 2022 | $7.5M | $1.1M |
| Dec 2021 | $7.6M | $1.1M |
| Nov 2021 | $6.5M | $975K |
| Oct 2021 | $7.2M | $1.1M |
| Sep 2021 | $5.0M | |
| Aug 2021 | $5.0M | $751K |
| Jul 2021 | $5.3M | $794K |
| Jun 2021 | $4.5M | $673K |
| May 2021 | $4.7M | $711K |
| Apr 2021 | $4.1M | $615K |
| Mar 2021 | $4.4M | $658K |
| Feb 2021 | $3.4M | $516K |
| Jan 2021 | $3.1M | $459K |
| Dec 2020 | $2.8M | $418K |
| Nov 2020 | $2.3M | $339K |
| Oct 2020 | $1.9M | $279K |
| Sep 2020 | $1.5M | $230K |
| Aug 2020 | $677K | $102K |
| Year | Revenue (GGR) | State tax |
|---|---|---|
| 2026 | $350M (9 mo) | $52.5M (9 mo) |
| 2025 | $375M | $56.3M |
| 2024 | $246M | $37.0M |
| 2023 | $157M | $23.6M |
| 2022 | $113M | $16.9M |
| 2021 | $60.9M | $8.4M (11 mo) |
| 2020 | $9.1M (5 mo) | $1.4M (5 mo) |
Years with missing months show partial totals, marked with the number of months reported.
Notes
GGR is adjusted gross interactive gaming receipts. Tax paid is the 15% interactive gaming privilege tax.
Sources
- WV Lottery Monthly Report on Lottery Operations --
- WV Lottery Monthly Report on Lottery Operations -- derived for 2024-09 (not submitted by the agency)
- WV Lottery Monthly Report on Lottery Operations -- derived for 2025-06 (not submitted by the agency)
Related charts
Same chart for other states
Connecticut · Delaware · Michigan · New Jersey · Pennsylvania · Rhode Island