States / Rhode Island / Chart
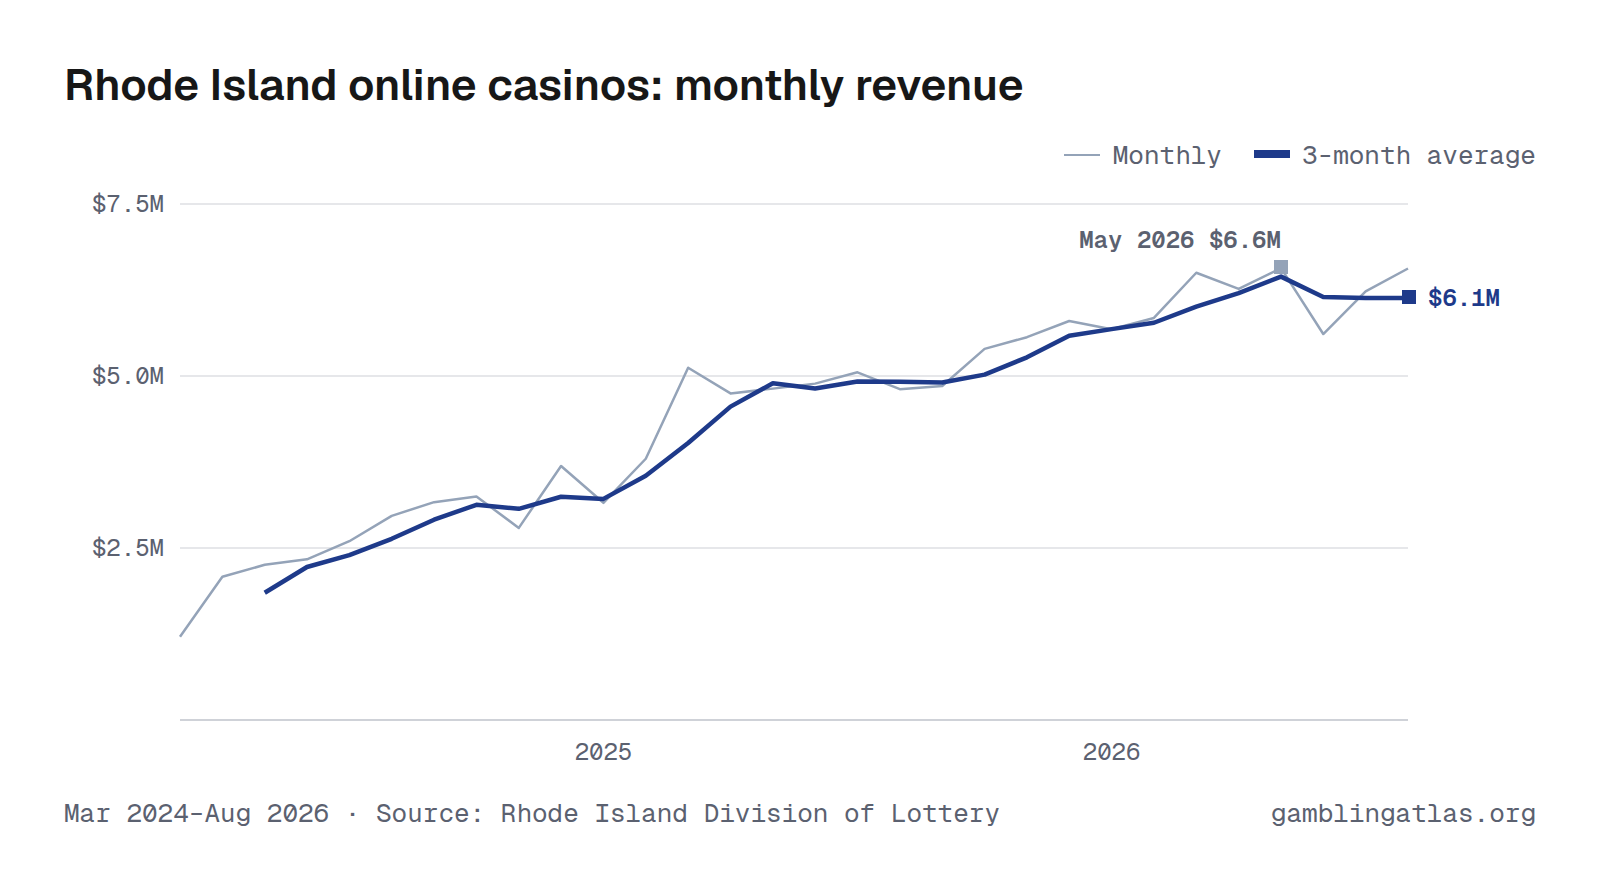
Rhode Island Online Casino Revenue and Handle by Month
Rhode Island online casinos produced $6.6M in gross gaming revenue in August 2026, up 36% from Aug 2025. Over the 12 months through Aug 2026, revenue totaled $70.9M on $1.72B in bets, a 4.1% hold. In the shared comparison window Sep 2025–Aug 2026, it ranked 7th largest of 7 states with monthly online casino revenue.
The highest month on record here is May 2026 ($6.6M). Monthly figures run from Mar 2024 to Aug 2026 and come from the Rhode Island Division of Lottery.
Mar 2024–Aug 2026 · Source: Rhode Island Division of Lottery · Rhode Island revenue
Handle (amount bet)
Download, embed or cite
Free to reuse with a link to this page. License and sources
Data
| Month | Handle | Revenue (GGR) | Hold |
|---|---|---|---|
| Aug 2026 | $148M | $6.6M | 4.4% |
| Jul 2026 | $153M | $6.2M | 4.1% |
| Jun 2026 | $142M | $5.6M | 4.0% |
| May 2026 | $156M | $6.6M | 4.2% |
| Apr 2026 | $154M | $6.3M | 4.1% |
| Mar 2026 | $162M | $6.5M | 4.0% |
| Feb 2026 | $139M | $5.8M | 4.2% |
| Jan 2026 | $134M | $5.7M | 4.2% |
| Dec 2025 | $140M | $5.8M | 4.1% |
| Nov 2025 | $135M | $5.6M | 4.1% |
| Oct 2025 | $131M | $5.4M | 4.1% |
| Sep 2025 | $126M | $4.9M | 3.9% |
| Aug 2025 | $128M | $4.8M | 3.8% |
| Jul 2025 | $120M | $5.1M | 4.2% |
| Jun 2025 | $123M | $4.9M | 4.0% |
| May 2025 | $129M | $4.8M | 3.7% |
| Apr 2025 | $127M | $4.7M | 3.7% |
| Mar 2025 | $131M | $5.1M | 3.9% |
| Feb 2025 | $110M | $3.8M | 3.5% |
| Jan 2025 | $104M | $3.2M | 3.0% |
| Dec 2024 | $97.2M | $3.7M | 3.8% |
| Nov 2024 | $79.7M | $2.8M | 3.5% |
| Oct 2024 | $75.1M | $3.2M | 4.3% |
| Sep 2024 | $80.8M | $3.2M | 3.9% |
| Aug 2024 | $74.6M | $3.0M | 4.0% |
| Jul 2024 | $67.7M | $2.6M | 3.8% |
| Jun 2024 | $61.9M | $2.3M | 3.8% |
| May 2024 | $61.2M | $2.3M | 3.7% |
| Apr 2024 | $48.0M | $2.1M | 4.3% |
| Mar 2024 | $31.1M | $1.2M | 3.9% |
| Year | Handle | Revenue (GGR) |
|---|---|---|
| 2026 | $1.19B (8 mo) | $49.3M (8 mo) |
| 2025 | $1.50B | $58.0M |
| 2024 | $678M (10 mo) | $26.3M (10 mo) |
Years with missing months show partial totals, marked with the number of months reported.
| Operator | Handle | GGR |
|---|---|---|
| Bally's Corporation | $1.72B | $70.9M |
License-holder totals may include partner-operated brands.
Notes
GGR is the Lottery's printed Net Gaming Revenue (wagers minus prizes) for iSlots and iTables combined, before commissions or expenses. The Lottery runs iGaming through Bally Interactive; the state's share is not printed in this report.
Sources
Related charts
Same chart for other states
Connecticut · Delaware · Michigan · New Jersey · Pennsylvania · West Virginia