States / New Jersey / Chart
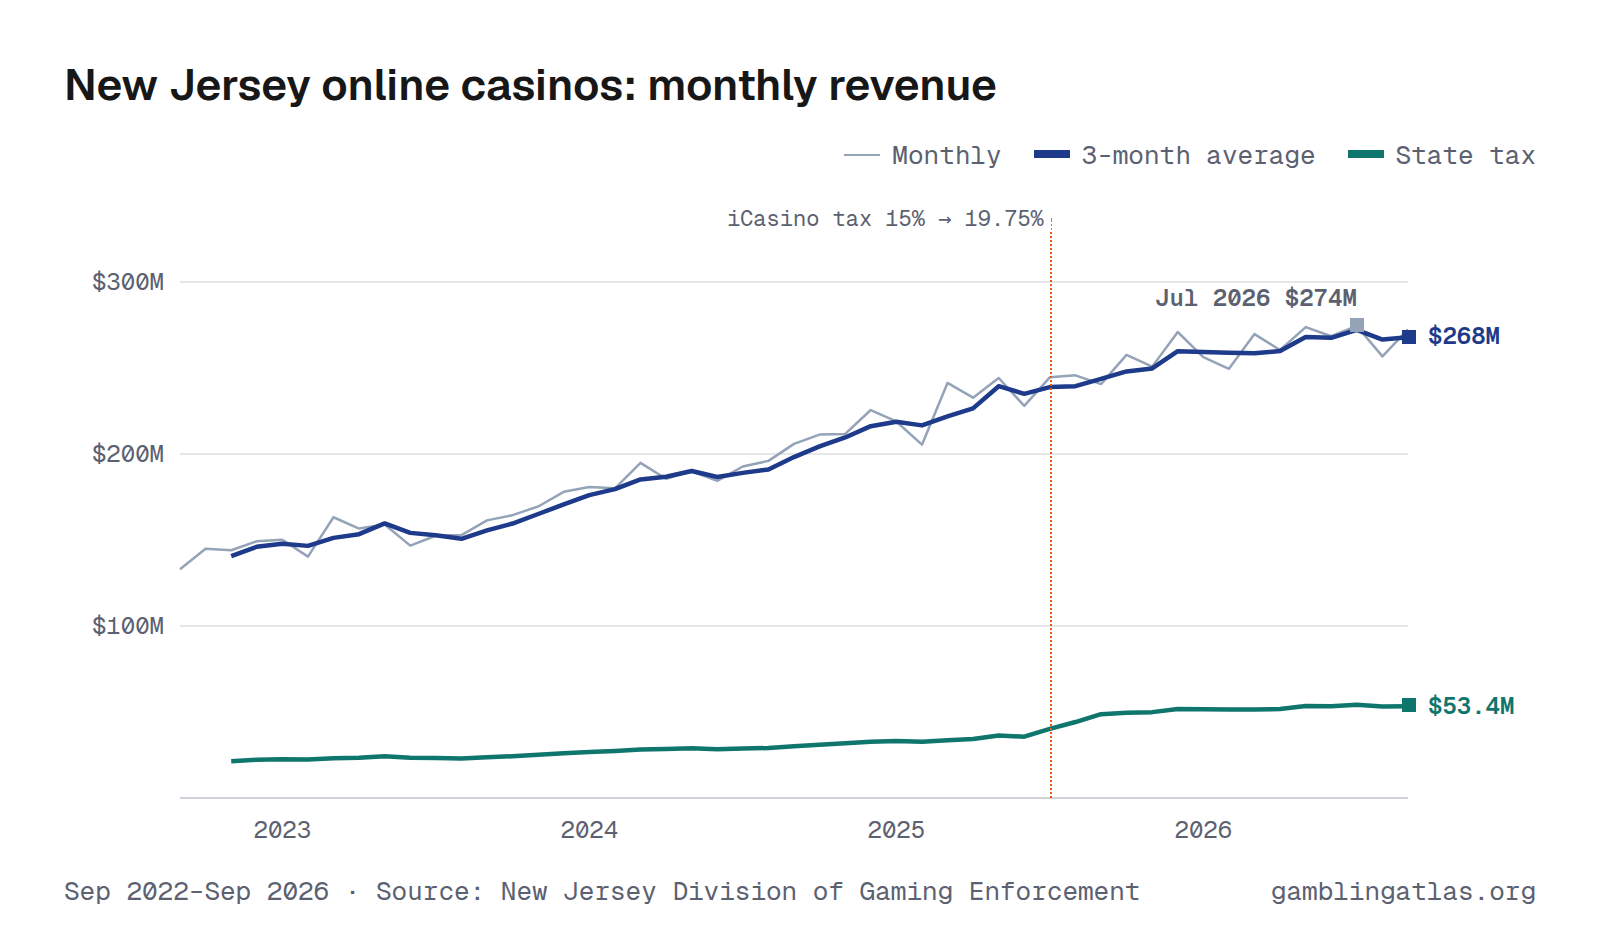
New Jersey Online Casino Revenue by Month
New Jersey online casinos produced $272M in gross gaming revenue in September 2026, up 13% from Sep 2025. Over the 12 months through Sep 2026, revenue totaled $3.16B, and the state collected $630M in tax. In the shared comparison window Sep 2025–Aug 2026, it ranked 2nd largest of 7 states with monthly online casino revenue.
The highest month on record here is Jul 2026 ($274M). Monthly figures run from Sep 2022 to Sep 2026 and come from the New Jersey Division of Gaming Enforcement.
Sep 2022–Sep 2026 · Source: New Jersey Division of Gaming Enforcement · New Jersey revenue
Download, embed or cite
Free to reuse with a link to this page. License and sources
Data
| Month | Revenue (GGR) | State tax |
|---|---|---|
| Sep 2026 | $272M | $54.3M |
| Aug 2026 | $257M | $51.2M |
| Jul 2026 | $274M | $54.7M |
| Jun 2026 | $268M | $53.6M |
| May 2026 | $274M | $54.5M |
| Apr 2026 | $260M | $52.0M |
| Mar 2026 | $270M | $53.7M |
| Feb 2026 | $250M | $49.5M |
| Jan 2026 | $256M | $51.0M |
| Dec 2025 | $271M | $53.9M |
| Nov 2025 | $251M | $50.0M |
| Oct 2025 | $258M | $51.5M |
| Sep 2025 | $241M | $48.3M |
| Aug 2025 | $246M | $49.1M |
| Jul 2025 | $245M | $48.9M |
| Jun 2025 | $228M | $34.5M |
| May 2025 | $244M | $37.1M |
| Apr 2025 | $233M | $35.3M |
| Mar 2025 | $241M | $36.5M |
| Feb 2025 | $205M | $31.1M |
| Jan 2025 | $219M | $33.0M |
| Dec 2024 | $226M | $34.1M |
| Nov 2024 | $212M | $32.2M |
| Oct 2024 | $211M | $31.9M |
| Sep 2024 | $206M | $31.2M |
| Aug 2024 | $196M | $29.7M |
| Jul 2024 | $193M | $29.4M |
| Jun 2024 | $184M | $28.0M |
| May 2024 | $190M | $28.8M |
| Apr 2024 | $186M | $28.2M |
| Mar 2024 | $195M | $29.6M |
| Feb 2024 | $180M | $27.5M |
| Jan 2024 | $181M | $27.4M |
| Dec 2023 | $178M | $27.1M |
| Nov 2023 | $170M | $25.7M |
| Oct 2023 | $164M | $25.1M |
| Sep 2023 | $161M | $24.5M |
| Aug 2023 | $153M | $23.2M |
| Jul 2023 | $152M | $23.2M |
| Jun 2023 | $147M | $22.4M |
| May 2023 | $159M | $24.2M |
| Apr 2023 | $157M | $23.7M |
| Mar 2023 | $163M | $24.9M |
| Feb 2023 | $140M | $21.4M |
| Jan 2023 | $150M | $22.9M |
| Dec 2022 | $149M | $22.8M |
| Nov 2022 | $144M | $21.7M |
| Oct 2022 | $145M | $22.1M |
| Sep 2022 | $133M | $20.2M |
| Year | Revenue (GGR) | State tax |
|---|---|---|
| 2026 | $2.38B (9 mo) | $474M (9 mo) |
| 2025 | $2.88B | $509M |
| 2024 | $2.36B | $358M |
| 2023 | $1.89B | $288M |
| 2022 | $571M (4 mo) | $86.9M (4 mo) |
Years with missing months show partial totals, marked with the number of months reported.
| Operator | GGR |
|---|---|
| Golden Nugget | $962M |
| Borgata | $699M |
| Mohegan | $657M |
| Caesars Entertainment | $307M |
| Hard Rock Digital | $244M |
| Bally's Corporation | $233M |
| Ocean Casino Resort | $59.8M |
License-holder totals may include partner-operated brands.
Notes
GGR is internet gaming gross revenue other than poker, from the DGE-105 return. Tax paid is the DGE-105 return's tax payment, which is a combined internet gaming and online poker figure. Tax is reported combined with online poker on one return and shown on the igaming series.
Sources
- NJ DGE-105 Internet Gaming Gross Revenue Report June
- NJ DGE-105 Internet Gaming Gross Revenue Report March
- NJ DGE-105 Internet Gaming Gross Revenue Report May
- NJ DGE-105 Internet Gaming Gross Revenue Report November
- NJ DGE-105 Internet Gaming Gross Revenue Report October
- NJ DGE-105 Internet Gaming Gross Revenue Report September
Related charts
Same chart for other states
Connecticut · Delaware · Michigan · Pennsylvania · Rhode Island · West Virginia