Charts / Chart
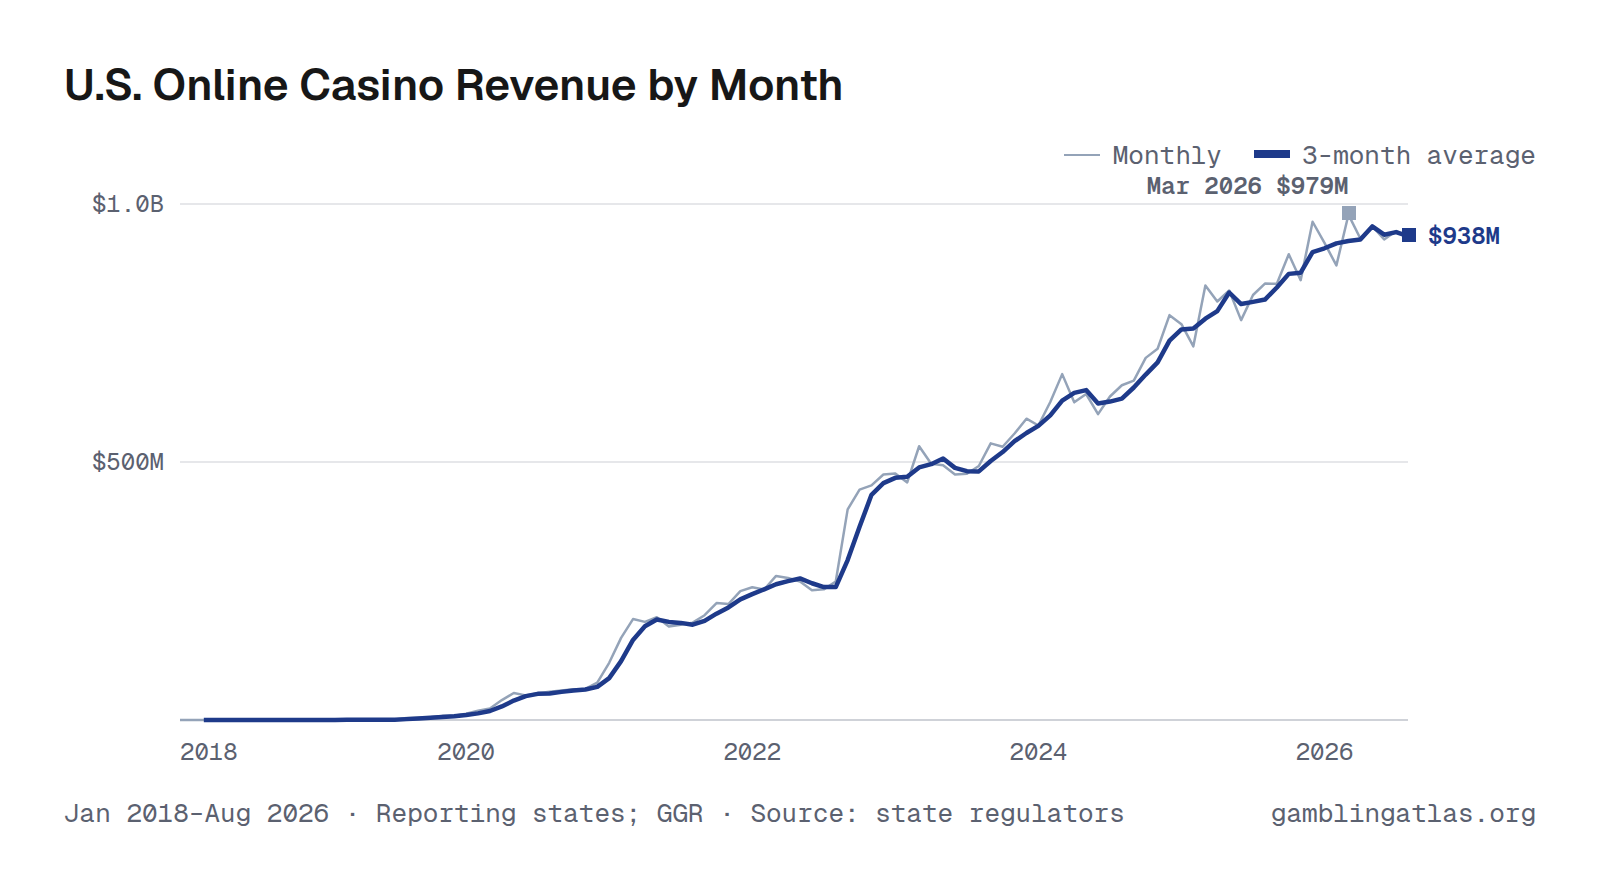
U.S. Online Casino Revenue by Month
U.S. online casino revenue totaled $935M in August 2026, up 10% from Aug 2025, across the 7 states that had reported. Over the 12 months through Aug 2026, it came to $11.1B.
The highest month in the series is Mar 2026 ($979M). National totals add up the states that report each month; a state joins when it launches and starts publishing.
Revenue is GGR; excludes markets without comparable public reports.
Jan 2018–Aug 2026 · Reporting states; GGR · Source: state regulators · Revenue
Download, embed or cite
Free to reuse with a link to this page. License and sources
Data
| Month | Amount | States reporting |
|---|---|---|
| Aug 2026 | $935M | 7 |
| Jul 2026 | $948M | 7 |
| Jun 2026 | $931M | 7 |
| May 2026 | $957M | 7 |
| Apr 2026 | $933M | 7 |
| Mar 2026 | $979M | 7 |
| Feb 2026 | $881M | 7 |
| Jan 2026 | $924M | 7 |
| Dec 2025 | $966M | 7 |
| Nov 2025 | $852M | 7 |
| Oct 2025 | $903M | 7 |
| Sep 2025 | $845M | 7 |
| Aug 2025 | $846M | 7 |
| Jul 2025 | $824M | 7 |
| Jun 2025 | $775M | 7 |
| May 2025 | $832M | 7 |
| Apr 2025 | $811M | 7 |
| Mar 2025 | $842M | 7 |
| Feb 2025 | $724M | 7 |
| Jan 2025 | $767M | 7 |
| Dec 2024 | $785M | 7 |
| Nov 2024 | $719M | 7 |
| Oct 2024 | $702M | 7 |
| Sep 2024 | $658M | 7 |
| Aug 2024 | $649M | 7 |
| Jul 2024 | $627M | 7 |
| Jun 2024 | $593M | 7 |
| May 2024 | $632M | 7 |
| Apr 2024 | $616M | 7 |
| Mar 2024 | $670M | 7 |
| Feb 2024 | $616M | 6 |
| Jan 2024 | $571M | 6 |
| Dec 2023 | $584M | 6 |
| Nov 2023 | $555M | 6 |
| Oct 2023 | $530M | 6 |
| Sep 2023 | $536M | 6 |
| Aug 2023 | $492M | 6 |
| Jul 2023 | $477M | 6 |
| Jun 2023 | $476M | 6 |
| May 2023 | $494M | 6 |
| Apr 2023 | $497M | 6 |
| Mar 2023 | $530M | 6 |
| Feb 2023 | $460M | 6 |
| Jan 2023 | $478M | 6 |
| Dec 2022 | $476M | 6 |
| Nov 2022 | $455M | 6 |
| Oct 2022 | $447M | 6 |
| Sep 2022 | $408M | 6 |
| Aug 2022 | $268M | 5 |
| Jul 2022 | $253M | 5 |
| Jun 2022 | $251M | 5 |
| May 2022 | $268M | 5 |
| Apr 2022 | $275M | 5 |
| Mar 2022 | $279M | 5 |
| Feb 2022 | $253M | 5 |
| Jan 2022 | $257M | 5 |
| Dec 2021 | $250M | 5 |
| Nov 2021 | $225M | 5 |
| Oct 2021 | $227M | 5 |
| Sep 2021 | $203M | 4 |
| Aug 2021 | $189M | 4 |
| Jul 2021 | $184M | 4 |
| Jun 2021 | $181M | 4 |
| May 2021 | $199M | 4 |
| Apr 2021 | $190M | 4 |
| Mar 2021 | $196M | 4 |
| Feb 2021 | $159M | 4 |
| Jan 2021 | $111M | 4 |
| Dec 2020 | $72.3M | 3 |
| Nov 2020 | $60.2M | 3 |
| Oct 2020 | $59.8M | 3 |
| Sep 2020 | $57.0M | 3 |
| Aug 2020 | $54.6M | 3 |
| Jul 2020 | $52.0M | 2 |
| Jun 2020 | $47.7M | 2 |
| May 2020 | $52.3M | 2 |
| Apr 2020 | $38.6M | 2 |
| Mar 2020 | $22.2M | 2 |
| Feb 2020 | $18.0M | 2 |
| Jan 2020 | $12.2M | 2 |
| Dec 2019 | $8.4M | 2 |
| Nov 2019 | $8.0M | 2 |
| Oct 2019 | $5.2M | 2 |
| Sep 2019 | $4.5M | 2 |
| Aug 2019 | $3.7M | 2 |
| Jul 2019 | $1.1M | 2 |
| Jun 2019 | $233K | 1 |
| May 2019 | $292K | 1 |
| Apr 2019 | $241K | 1 |
| Mar 2019 | $263K | 1 |
| Feb 2019 | $249K | 1 |
| Jan 2019 | $257K | 1 |
| Dec 2018 | $223K | 1 |
| Nov 2018 | $191K | 1 |
| Oct 2018 | $209K | 1 |
| Sep 2018 | $316K | 1 |
| Aug 2018 | $198K | 1 |
| Jul 2018 | $224K | 1 |
| Jun 2018 | $145K | 1 |
| May 2018 | $150K | 1 |
| Apr 2018 | $173K | 1 |
| Mar 2018 | $150K | 1 |
| Feb 2018 | $198K | 1 |
| Jan 2018 | $159K | 1 |
National totals add up the states that report each month; a state joins when it launches and starts publishing. Revenue is GGR; excludes markets without comparable public reports.
Related charts
By state
Connecticut · Delaware · Michigan · New Jersey · Pennsylvania · Rhode Island · West Virginia