Charts / Chart
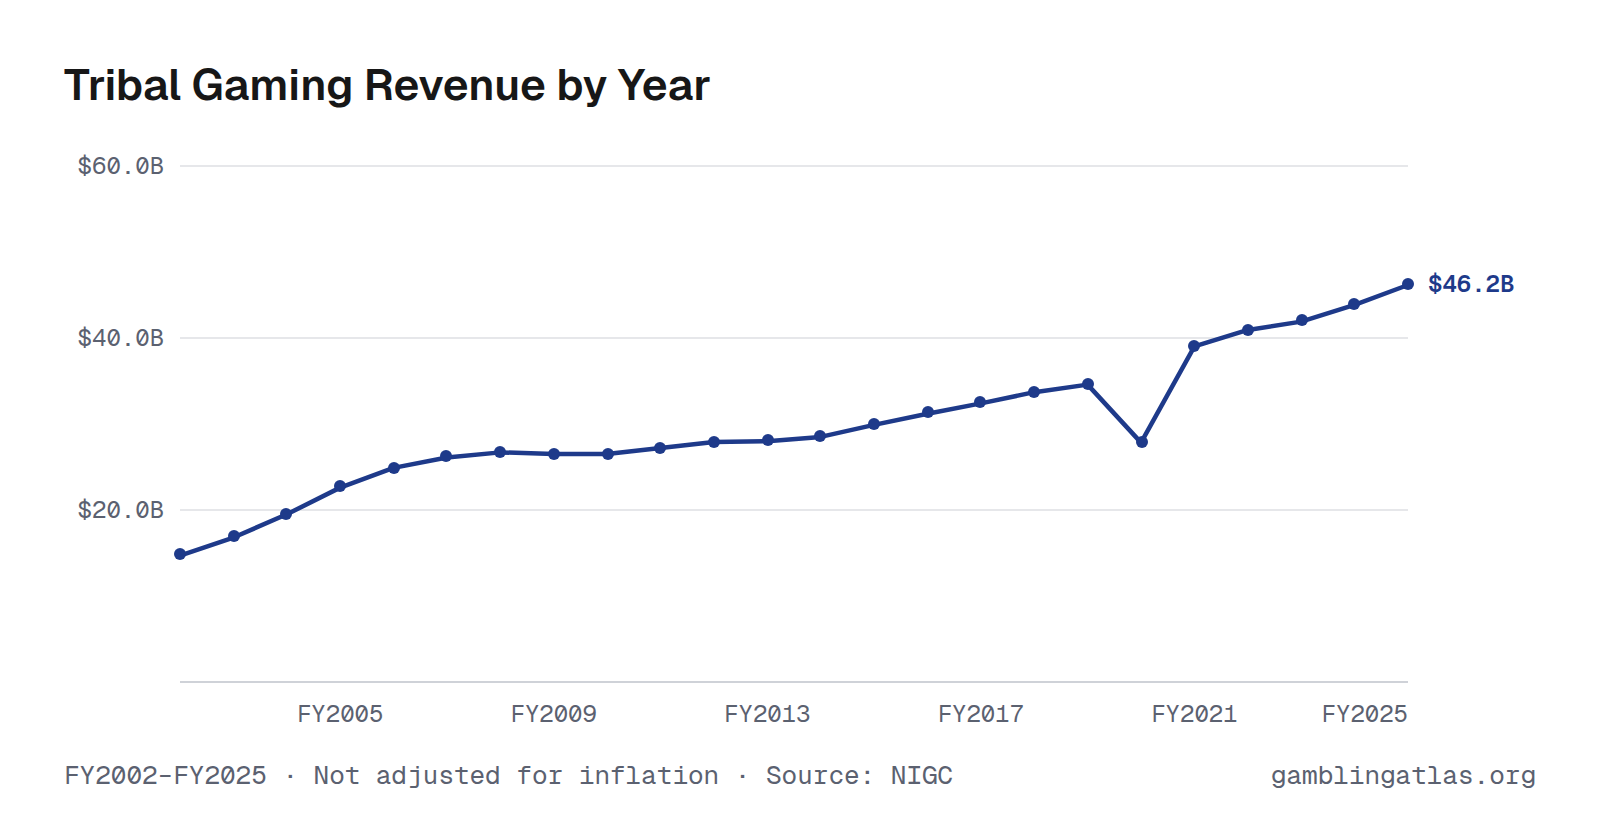
Tribal Gaming Revenue by Year
Tribal gaming operations brought in $46.2B in FY2025, up 5% from FY2024, according to the National Indian Gaming Commission. In FY2002 it was $14.7B. Consumer prices rose 79% between FY2002 and FY2025, so after inflation revenue grew 76%.
$20.0B$40.0B$60.0BFY2005FY2009FY2013FY2017FY2021FY2025$46.2B
FY2002–FY2025 · Not adjusted for inflation · Source: NIGC · Tribal casinos
Download, embed or cite
Free to reuse with a link to this page. License and sources
Data
| Fiscal year | Revenue | Operations |
|---|---|---|
| FY2025 | $46.2B | 545 |
| FY2024 | $43.9B | 532 |
| FY2023 | $41.9B | 527 |
| FY2022 | $40.9B | 519 |
| FY2021 | $39.0B | 510 |
| FY2020 | $27.8B | |
| FY2019 | $34.6B | |
| FY2018 | $33.7B | |
| FY2017 | $32.4B | |
| FY2016 | $31.2B | |
| FY2015 | $29.9B | |
| FY2014 | $28.5B | |
| FY2013 | $28.0B | |
| FY2012 | $27.9B | |
| FY2011 | $27.2B | |
| FY2010 | $26.5B | |
| FY2009 | $26.5B | |
| FY2008 | $26.7B | |
| FY2007 | $26.1B | |
| FY2006 | $24.9B | |
| FY2005 | $22.6B | |
| FY2004 | $19.5B | |
| FY2003 | $16.8B | |
| FY2002 | $14.7B |
Sources
- NIGC FY 2024 Gross Gaming Revenue Report
- FY21 vs FY20/FY19 GGR Comparison
- NIGC FY 2023 Gross Gaming Revenue Report
- NIGC FY 2025 Gross Gaming Revenue Report
- U.S. Bureau of Labor Statistics, Consumer Price Index for All Urban Consumers (CPI-U), U.S. city average, all items, not seasonally adjusted (CUUR0000SA0)