Charts / Chart
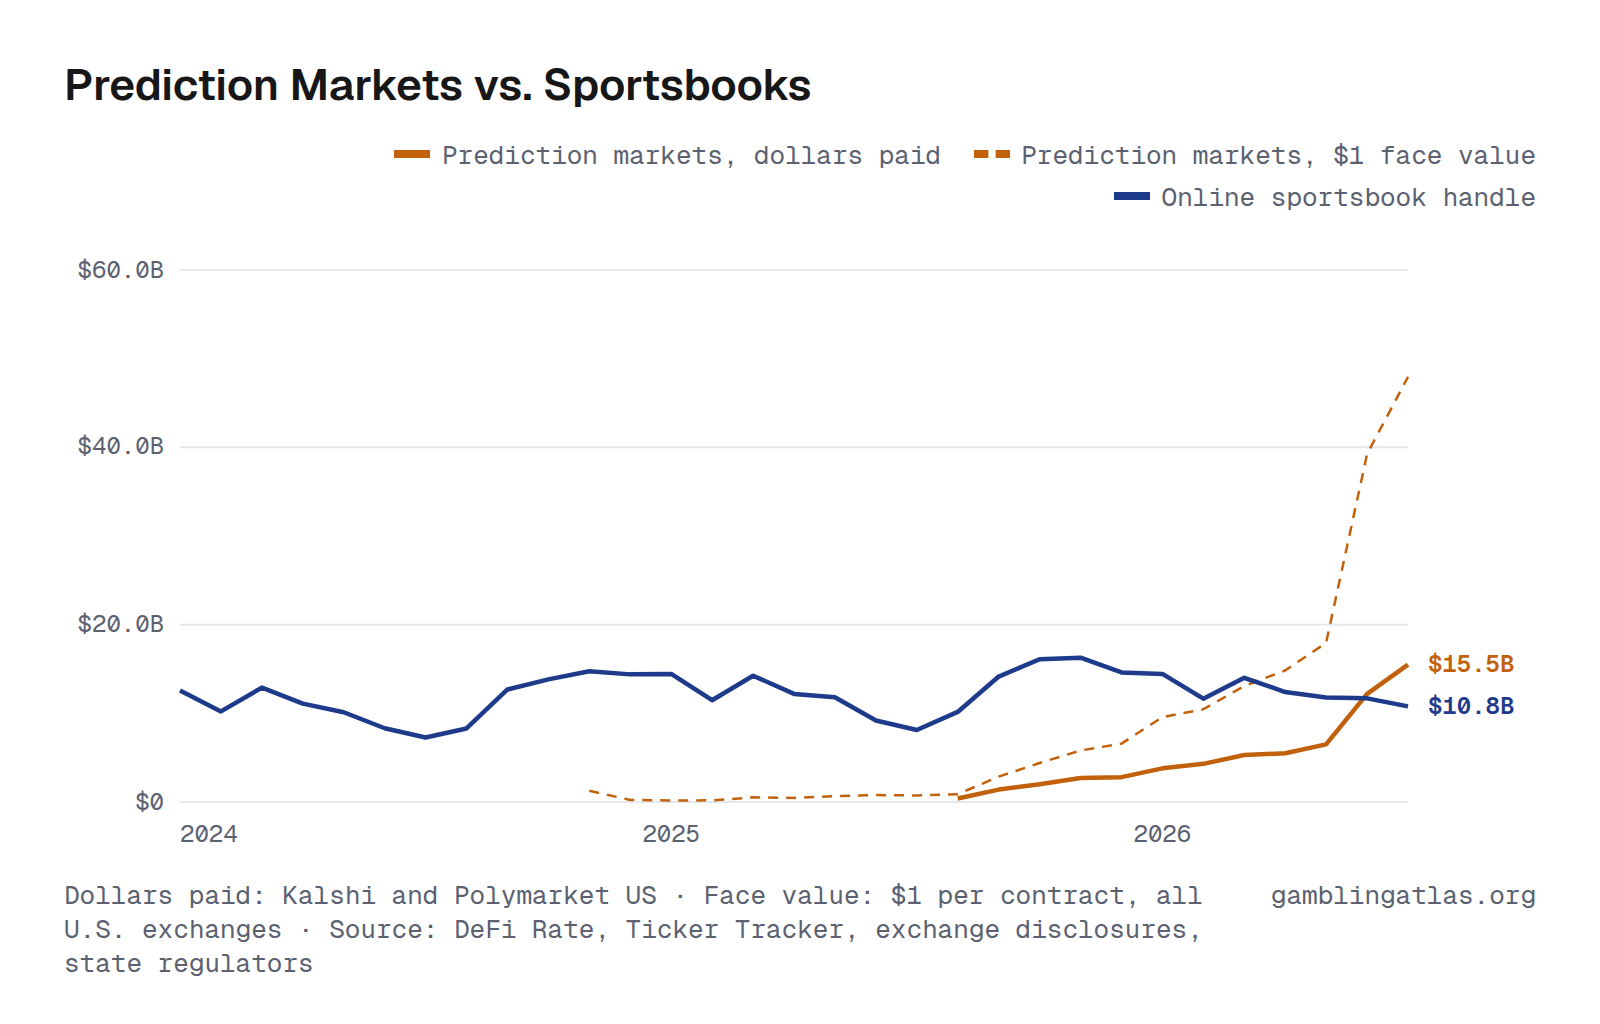
Prediction Markets vs. Sportsbooks: Monthly Volume and Handle
In July 2026, traders paid $15.5B for prediction-market contracts on Kalshi and Polymarket US, 1.4 times the $10.8B bet with online sportsbooks in the 27 states that reported handle. Counted at $1 face value, as exchanges report volume, U.S. exchanges traded $47.9B.
Each $1 contract is funded by the two traders on either side of it. Dollars paid counts one side, at the price it traded, which is closest to sportsbook handle: the bettor's stake, without the sportsbook's side. Face value counts both sides together.
Dollars paid starts in August 2025 and covers Kalshi and Polymarket US, which account for nearly all U.S. exchange volume. Prediction-market figures cover every topic and every state; sportsbook handle covers only legal, state-regulated bets.
Dollars paid: Kalshi and Polymarket US · Face value: $1 per contract, all U.S. exchanges · Source: DeFi Rate, Ticker Tracker, exchange disclosures, state regulators · Prediction markets
Download, embed or cite
Free to reuse with a link to this page. License and sources
Data
| Month | Prediction markets, dollars paid (Kalshi and Polymarket US) | Prediction markets, volume at $1 face value (all U.S. exchanges) | Online sportsbook handle | States reporting handle |
|---|---|---|---|---|
| Jul 2026 | $15.5B | $47.9B | $10.8B | 27 |
| Jun 2026 | $12.2B | $39.2B | $11.7B | 27 |
| May 2026 | $6.50B | $17.9B | $11.8B | 27 |
| Apr 2026 | $5.50B | $14.8B | $12.4B | 27 |
| Mar 2026 | $5.30B | $13.1B | $14.0B | 27 |
| Feb 2026 | $4.30B | $10.5B | $11.7B | 27 |
| Jan 2026 | $3.80B | $9.58B | $14.4B | 27 |
| Dec 2025 | $2.80B | $6.58B | $14.6B | 27 |
| Nov 2025 | $2.70B | $5.81B | $16.3B | 26 |
| Oct 2025 | $2.00B | $4.40B | $16.1B | 26 |
| Sep 2025 | $1.40B | $2.86B | $14.2B | 26 |
| Aug 2025 | $398M | $874M | $10.2B | 26 |
| Jul 2025 | $740M | $8.13B | 26 | |
| Jun 2025 | $782M | $9.20B | 26 | |
| May 2025 | $664M | $11.8B | 26 | |
| Apr 2025 | $460M | $12.2B | 26 | |
| Mar 2025 | $521M | $14.2B | 26 | |
| Feb 2025 | $187M | $11.5B | 26 | |
| Jan 2025 | $175M | $14.4B | 26 | |
| Dec 2024 | $226M | $14.4B | 26 | |
| Nov 2024 | $1.27B | $14.8B | 26 | |
| Oct 2024 | $13.8B | 26 | ||
| Sep 2024 | $12.7B | 26 | ||
| Aug 2024 | $8.29B | 26 | ||
| Jul 2024 | $7.27B | 26 | ||
| Jun 2024 | $8.31B | 25 | ||
| May 2024 | $10.1B | 25 | ||
| Apr 2024 | $11.1B | 25 | ||
| Mar 2024 | $12.9B | 25 | ||
| Feb 2024 | $10.2B | 24 | ||
| Jan 2024 | $12.6B | 24 |