Charts / Chart
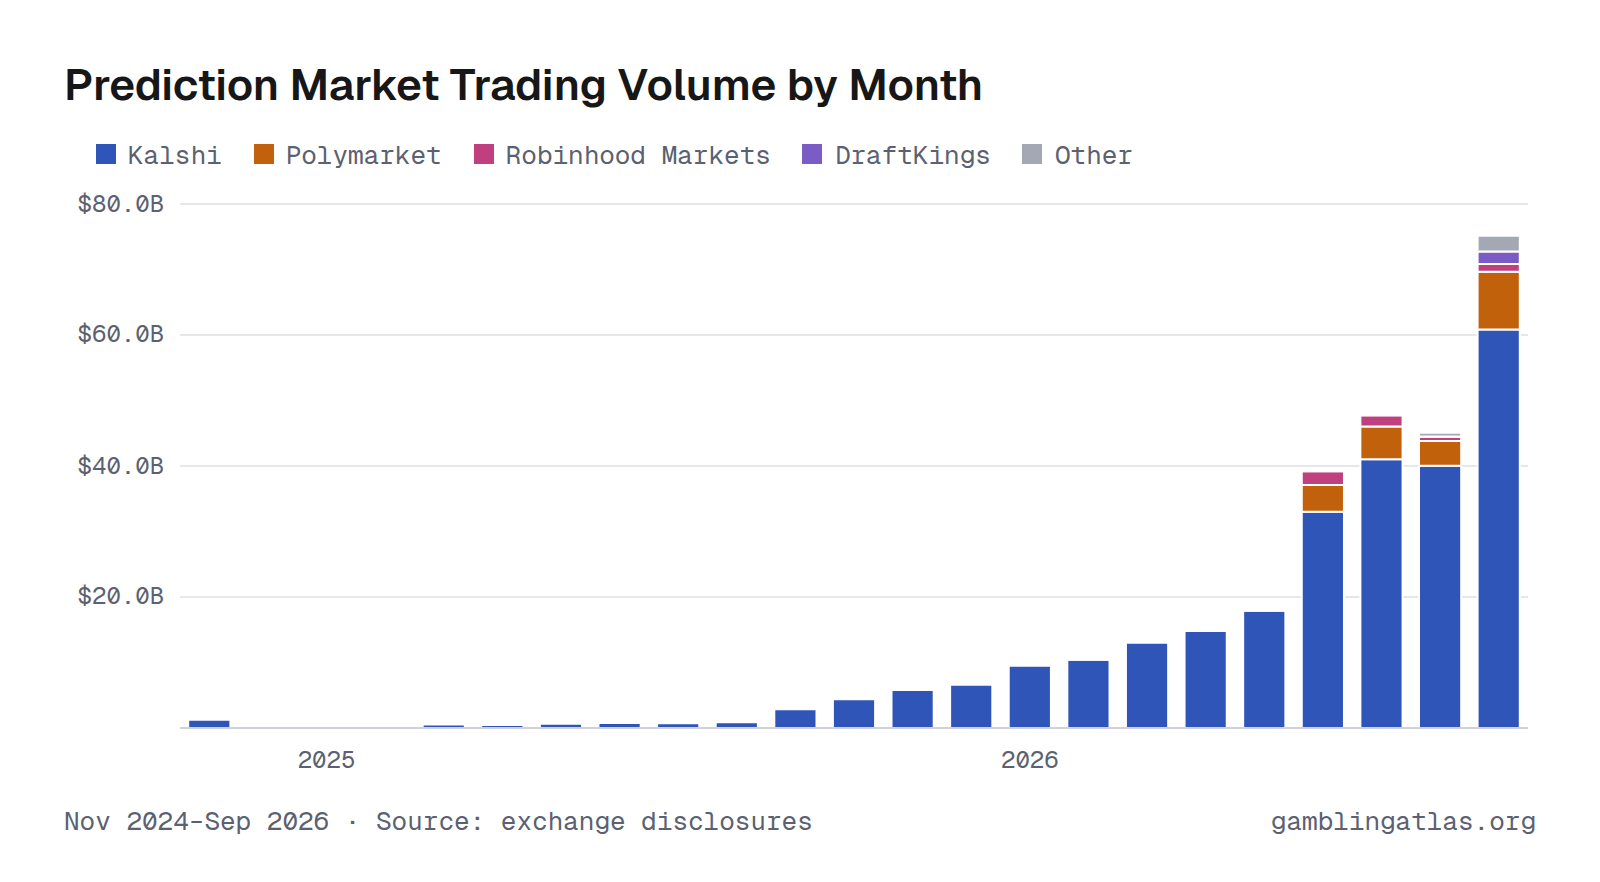
Prediction Market Trading Volume by Month: Kalshi, Polymarket and Others
U.S. prediction-market exchanges traded $75.1B in contracts in September 2026. Kalshi was the largest, with 81% of volume. Of the 8 exchanges trading that month, 7 had no volume in September 2025; they traded $14.3B.
Volume is the notional value of contracts traded, which is not comparable one-for-one with sportsbook handle.
KalshiPolymarketRobinhood MarketsDraftKingsOther
$20.0B$40.0B$60.0B$80.0B20252026
Nov 2024–Sep 2026 · Source: exchange disclosures · Prediction markets
Download, embed or cite
Free to reuse with a link to this page. License and sources
Data
| Month | Kalshi | Polymarket | Robinhood Markets | DraftKings | Other | Total |
|---|---|---|---|---|---|---|
| Sep 2026 | $60.8B | $8.80B | $1.20B | $1.90B | $2.40B | $75.1B |
| Aug 2026 | $40.0B | $3.80B | $598M | $89.0M | $551M | $45.1B |
| Jul 2026 | $41.0B | $5.00B | $1.70B | $12.0M | $181M | $47.9B |
| Jun 2026 | $33.0B | $4.10B | $2.10B | $47.0M | $39.2B | |
| May 2026 | $17.9B | $38.0M | $17.9B | |||
| Apr 2026 | $14.8B | $30.0M | $14.8B | |||
| Mar 2026 | $13.1B | $17.0M | $13.1B | |||
| Feb 2026 | $10.4B | $22.0M | $10.5B | |||
| Jan 2026 | $9.55B | $21.0M | $9.58B | |||
| Dec 2025 | $6.58B | $6.58B | ||||
| Nov 2025 | $5.81B | $5.81B | ||||
| Oct 2025 | $4.40B | $4.40B | ||||
| Sep 2025 | $2.86B | $2.86B | ||||
| Aug 2025 | $874M | $874M | ||||
| Jul 2025 | $740M | $740M | ||||
| Jun 2025 | $782M | $782M | ||||
| May 2025 | $664M | $664M | ||||
| Apr 2025 | $460M | $460M | ||||
| Mar 2025 | $521M | $521M | ||||
| Feb 2025 | $187M | $187M | ||||
| Jan 2025 | $175M | $175M | ||||
| Dec 2024 | $226M | $226M | ||||
| Nov 2024 | $1.27B | $1.27B |
Notes
Months missing an established exchange’s report are omitted; reporting obligations end only with a documented closure or reporting change.