Charts / Chart
Horse Racing Betting Handle by Year
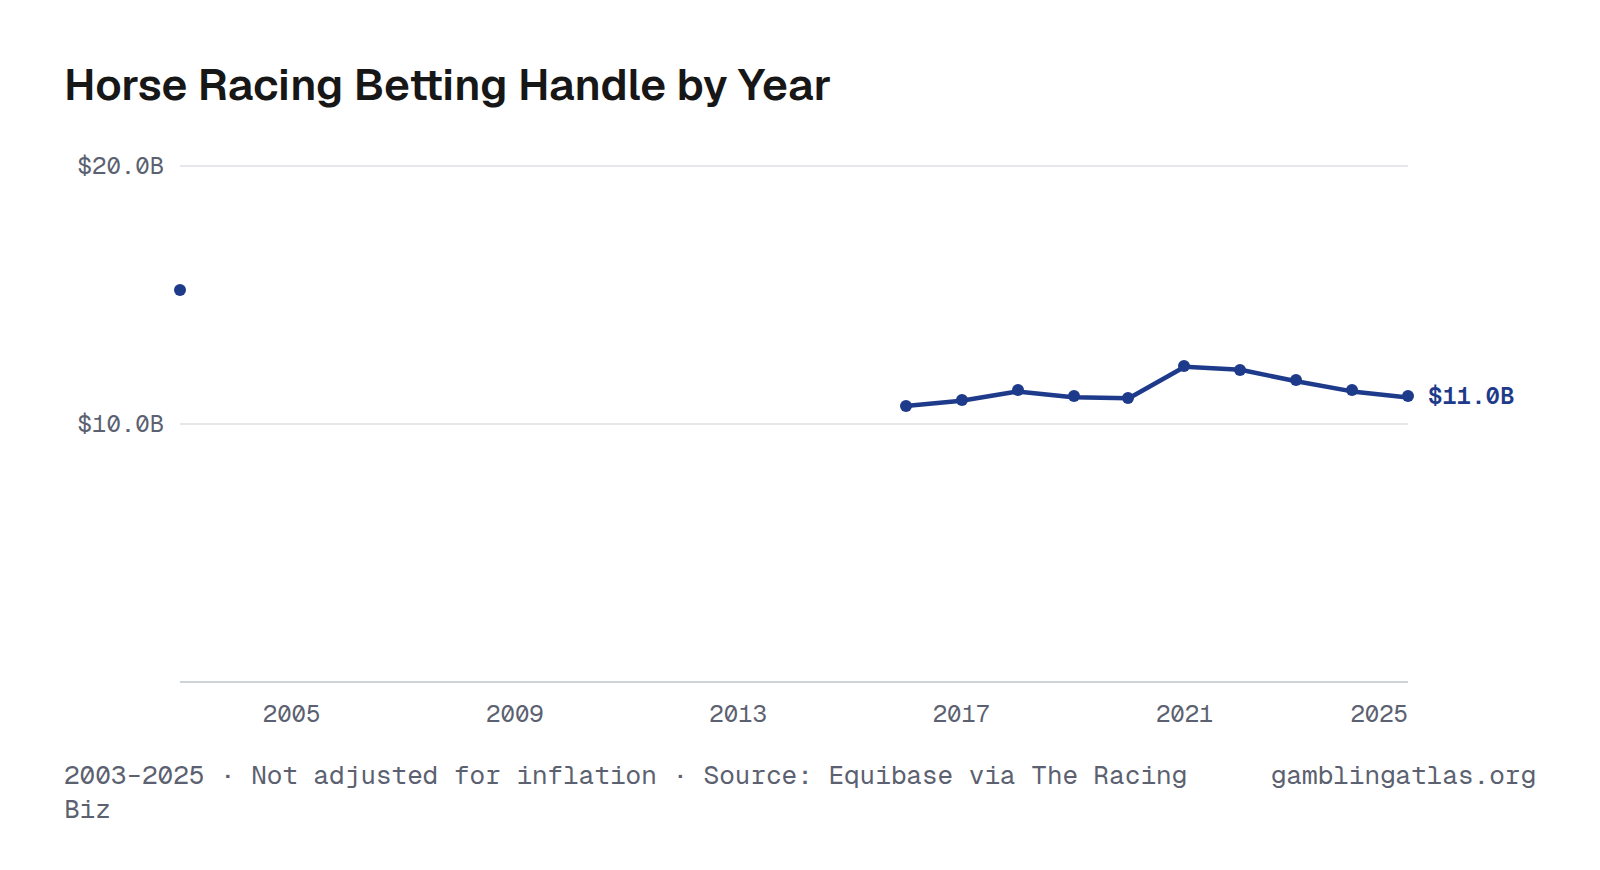
Americans bet $11.0B on horse racing in 2025. Pari-mutuel handle peaked at $15.2B in 2003. Consumer prices rose 75% between 2003 and 2025, so after inflation handle fell 58%.
$10.0B$20.0B200520092013201720212025$11.0B
2003–2025 · Not adjusted for inflation · Source: Equibase via The Racing Biz · Horse racing
Download, embed or cite
Free to reuse with a link to this page. License and sources
Data
| Year | Handle | Race days | Purses |
|---|---|---|---|
| $2,025 | $11.0B | $1.28B | |
| $2,024 | $11.3B | ||
| $2,023 | $11.7B | ||
| $2,022 | $12.1B | ||
| $2,021 | $12.2B | ||
| $2,020 | $11.0B | ||
| $2,019 | $11.0B | ||
| $2,018 | $11.3B | ||
| $2,017 | $10.9B | ||
| $2,016 | $10.7B | ||
| $2,003 | $15.2B |
Sources
- Wagering On U.S. Racing Highest Since 2009
- National wagering handle declined in 2024
- Handle slumps in December as 2024 lags prior year
- Wagering handle off sharply in December, down for year
- U.S. Bureau of Labor Statistics, Consumer Price Index for All Urban Consumers (CPI-U), U.S. city average, all items, not seasonally adjusted (CUUR0000SA0)