Charts / Chart
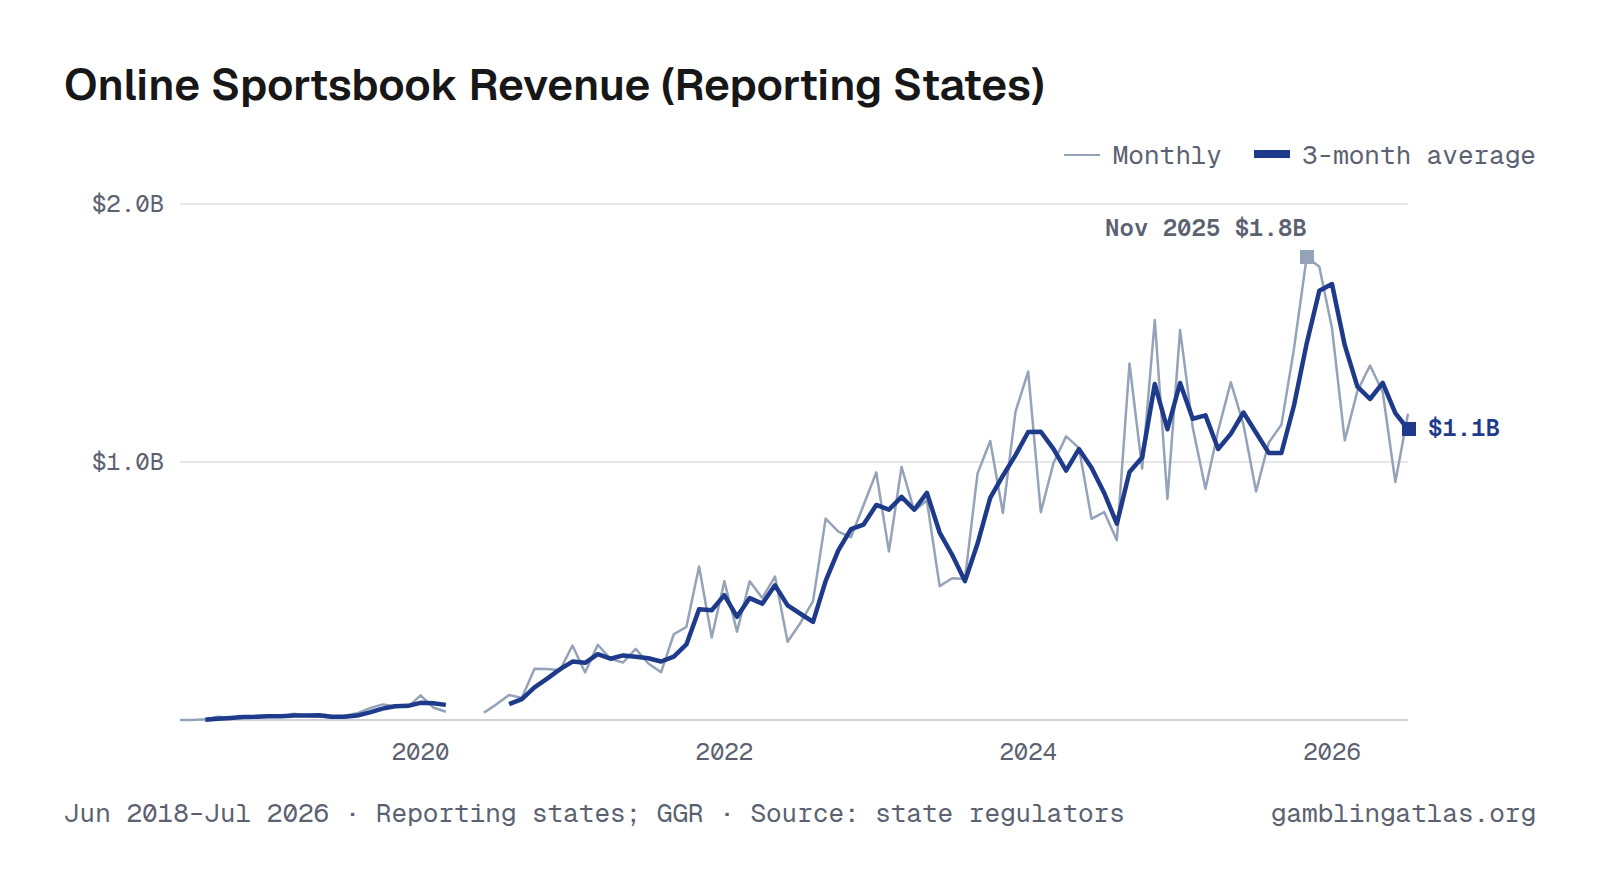
Online Sportsbook Revenue (Reporting States)
U.S. online sportsbook revenue totaled $1.19B in July 2026, up 34% from Jul 2025, across the 27 states that had reported. Over the 12 months through Jul 2026, it came to $15.8B.
The highest month in the series is Nov 2025 ($1.79B). National totals add up the states that report each month; a state joins when it launches and starts publishing.
Revenue is GGR; excludes markets without comparable public reports.
Jun 2018–Jul 2026 · Reporting states; GGR · Source: state regulators · Revenue
Download, embed or cite
Free to reuse with a link to this page. License and sources
Data
| Month | Amount | States reporting |
|---|---|---|
| Jul 2026 | $1.19B | 27 |
| Jun 2026 | $923M | 27 |
| May 2026 | $1.27B | 27 |
| Apr 2026 | $1.37B | 27 |
| Mar 2026 | $1.28B | 27 |
| Feb 2026 | $1.08B | 27 |
| Jan 2026 | $1.52B | 27 |
| Dec 2025 | $1.76B | 27 |
| Nov 2025 | $1.79B | 26 |
| Oct 2025 | $1.44B | 26 |
| Sep 2025 | $1.14B | 26 |
| Aug 2025 | $1.08B | 26 |
| Jul 2025 | $886M | 26 |
| Jun 2025 | $1.14B | 26 |
| May 2025 | $1.31B | 26 |
| Apr 2025 | $1.12B | 26 |
| Mar 2025 | $896M | 26 |
| Feb 2025 | $1.13B | 26 |
| Jan 2025 | $1.51B | 26 |
| Dec 2024 | $857M | 26 |
| Nov 2024 | $1.55B | 26 |
| Oct 2024 | $974M | 26 |
| Sep 2024 | $1.38B | 26 |
| Aug 2024 | $697M | 26 |
| Jul 2024 | $806M | 26 |
| Jun 2024 | $780M | 25 |
| May 2024 | $1.05B | 25 |
| Apr 2024 | $1.10B | 25 |
| Mar 2024 | $996M | 25 |
| Feb 2024 | $805M | 24 |
| Jan 2024 | $1.35B | 24 |
| Dec 2023 | $1.20B | 23 |
| Nov 2023 | $803M | 23 |
| Oct 2023 | $1.08B | 22 |
| Sep 2023 | $956M | 22 |
| Aug 2023 | $546M | 21 |
| Jul 2023 | $549M | 21 |
| Jun 2023 | $519M | 22 |
| May 2023 | $850M | 22 |
| Apr 2023 | $811M | 22 |
| Mar 2023 | $981M | 22 |
| Feb 2023 | $653M | 21 |
| Jan 2023 | $959M | 21 |
| Dec 2022 | $834M | 19 |
| Nov 2022 | $708M | 19 |
| Oct 2022 | $730M | 18 |
| Sep 2022 | $781M | 18 |
| Aug 2022 | $461M | 18 |
| Jul 2022 | $376M | 18 |
| Jun 2022 | $304M | 18 |
| May 2022 | $556M | 18 |
| Apr 2022 | $473M | 18 |
| Mar 2022 | $538M | 18 |
| Feb 2022 | $342M | 18 |
| Jan 2022 | $538M | 18 |
| Dec 2021 | $320M | 15 |
| Nov 2021 | $595M | 15 |
| Oct 2021 | $361M | 15 |
| Sep 2021 | $332M | 14 |
| Aug 2021 | $185M | 12 |
| Jul 2021 | $219M | 12 |
| Jun 2021 | $276M | 12 |
| May 2021 | $223M | 12 |
| Apr 2021 | $237M | 12 |
| Mar 2021 | $292M | 12 |
| Feb 2021 | $184M | 12 |
| Jan 2021 | $289M | 12 |
| Dec 2020 | $192M | 9 |
| Nov 2020 | $198M | 9 |
| Oct 2020 | $198M | 9 |
| Sep 2020 | $85.7M | 9 |
| Aug 2020 | $96.5M | 9 |
| Jul 2020 | $60.6M | 9 |
| Jun 2020 | $27.8M | 8 |
| Mar 2020 | $32.0M | 8 |
| Feb 2020 | $48.5M | 7 |
| Jan 2020 | $95.4M | 7 |
| Dec 2019 | $50.3M | 6 |
| Nov 2019 | $53.5M | 5 |
| Oct 2019 | $60.5M | 5 |
| Sep 2019 | $45.8M | 4 |
| Aug 2019 | $25.9M | 3 |
| Jul 2019 | $16.8M | 2 |
| Jun 2019 | $8.4M | 2 |
| May 2019 | $13.8M | 2 |
| Apr 2019 | $16.6M | 1 |
| Mar 2019 | $24.3M | 1 |
| Feb 2019 | $12.9M | 1 |
| Jan 2019 | $15.5M | 1 |
| Dec 2018 | $14.7M | 1 |
| Nov 2018 | $14.4M | 1 |
| Oct 2018 | $8.8M | 1 |
| Sep 2018 | $12.6M | 1 |
| Aug 2018 | $3.1M | 1 |
| Jul 2018 | $0 | 1 |
| Jun 2018 | $0 | 1 |
National totals add up the states that report each month; a state joins when it launches and starts publishing. Revenue is GGR; excludes markets without comparable public reports.
Related charts
By state
Arizona · Arkansas · Colorado · Connecticut · District of Columbia · Illinois · Indiana · Iowa · Kansas · Kentucky · Louisiana · Maine · Maryland · Massachusetts · Michigan · Nevada · New Hampshire · New Jersey · New York · North Carolina · Ohio · Pennsylvania · Rhode Island · Tennessee · Vermont · Virginia · Wyoming