Nevada Online Sports Betting Revenue and Handle by Month
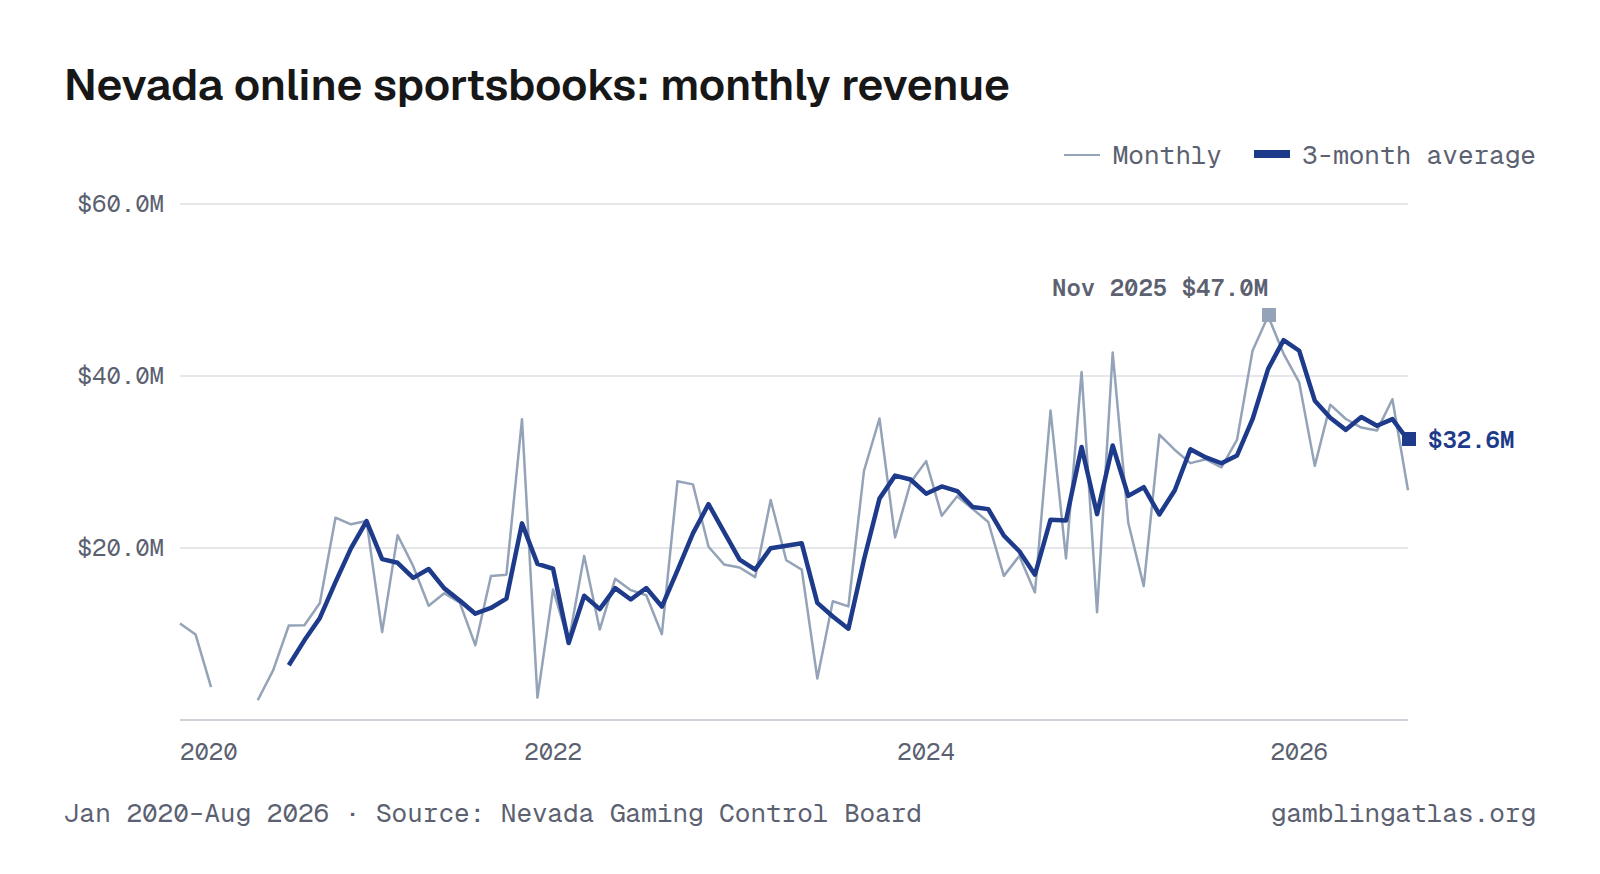
Nevada online sportsbooks produced $26.7M in gross gaming revenue in August 2026, down 9% from Aug 2025. Over the 12 months through Aug 2026, revenue totaled $437M on $5.71B in bets, a 7.7% hold. In the shared comparison window Sep 2025–Aug 2026, it ranked 14th largest of 25 states with monthly online sports betting revenue.
The highest month on record here is Nov 2025 ($47.0M). Monthly figures run from Jan 2020 to Aug 2026 and come from the Nevada Gaming Control Board.
Jan 2020–Aug 2026 · Source: Nevada Gaming Control Board · Nevada revenue
Handle (amount bet)
Download, embed or cite
Free to reuse with a link to this page. License and sources
Data
| Month | Handle | Revenue (GGR) | Hold |
|---|---|---|---|
| Aug 2026 | $324M | $26.7M | 8.2% |
| Jul 2026 | $352M | $37.3M | 10.6% |
| Jun 2026 | $416M | $33.7M | 8.1% |
| May 2026 | $410M | $34.0M | 8.3% |
| Apr 2026 | $398M | $35.0M | 8.8% |
| Mar 2026 | $551M | $36.7M | 6.7% |
| Feb 2026 | $413M | $29.6M | 7.2% |
| Jan 2026 | $562M | $39.3M | 7.0% |
| Dec 2025 | $541M | $42.6M | 7.9% |
| Nov 2025 | $655M | $47.0M | 7.2% |
| Oct 2025 | $556M | $42.9M | 7.7% |
| Sep 2025 | $532M | $32.6M | 6.1% |
| Aug 2025 | $337M | $29.4M | 8.7% |
| Jul 2025 | $317M | $30.3M | 9.6% |
| Jun 2025 | $360M | $29.9M | 8.3% |
| May 2025 | $423M | $31.4M | 7.4% |
| Apr 2025 | $483M | $33.2M | 6.9% |
| Mar 2025 | $613M | $15.6M | 2.5% |
| Feb 2025 | $397M | $22.9M | 5.8% |
| Jan 2025 | $534M | $42.7M | 8.0% |
| Dec 2024 | $572M | $12.5M | 2.2% |
| Nov 2024 | $586M | $40.5M | 6.9% |
| Oct 2024 | $521M | $18.8M | 3.6% |
| Sep 2024 | $485M | $36.0M | 7.4% |
| Aug 2024 | $313M | $14.8M | 4.7% |
| Jul 2024 | $254M | $19.1M | 7.5% |
| Jun 2024 | $314M | $16.8M | 5.3% |
| May 2024 | $351M | $23.0M | 6.5% |
| Apr 2024 | $390M | $24.5M | 6.3% |
| Mar 2024 | $507M | $26.0M | 5.1% |
| Feb 2024 | $423M | $23.8M | 5.6% |
| Jan 2024 | $509M | $30.1M | 5.9% |
| Dec 2023 | $562M | $27.6M | 4.9% |
| Nov 2023 | $625M | $21.2M | 3.4% |
| Oct 2023 | $537M | $35.1M | 6.5% |
| Sep 2023 | $539M | $29.0M | 5.4% |
| Aug 2023 | $317M | $13.2M | 4.2% |
| Jul 2023 | $268M | $13.8M | 5.2% |
| Jun 2023 | $324M | $4.8M | 1.5% |
| May 2023 | $358M | $17.5M | 4.9% |
| Apr 2023 | $395M | $18.6M | 4.7% |
| Mar 2023 | $532M | $25.6M | 4.8% |
| Feb 2023 | $402M | $16.6M | 4.1% |
| Jan 2023 | $582M | $17.7M | 3.1% |
| Dec 2022 | $603M | $18.1M | 3.0% |
| Nov 2022 | $642M | $20.1M | 3.1% |
| Oct 2022 | $613M | $27.4M | 4.5% |
| Sep 2022 | $492M | $27.7M | 5.6% |
| Aug 2022 | $293M | $10.0M | 3.4% |
| Jul 2022 | $274M | $14.5M | 5.3% |
| Jun 2022 | $330M | $15.1M | 4.6% |
| May 2022 | $398M | $16.4M | 4.1% |
| Apr 2022 | $424M | $10.5M | 2.5% |
| Mar 2022 | $577M | $19.1M | 3.3% |
| Feb 2022 | $512M | $9.1M | 1.8% |
| Jan 2022 | $787M | $15.2M | 1.9% |
| Dec 2021 | $765M | $2.6M | 0.3% |
| Nov 2021 | $777M | $35.0M | 4.5% |
| Oct 2021 | $704M | $16.9M | 2.4% |
| Sep 2021 | $495M | $16.7M | 3.4% |
| Aug 2021 | $296M | $8.7M | 2.9% |
| Jul 2021 | $242M | $13.6M | 5.6% |
| Jun 2021 | $314M | $14.7M | 4.7% |
| May 2021 | $298M | $13.3M | 4.5% |
| Apr 2021 | $297M | $17.9M | 6.0% |
| Mar 2021 | $385M | $21.5M | 5.6% |
| Feb 2021 | $316M | $10.2M | 3.2% |
| Jan 2021 | $364M | $23.1M | 6.4% |
| Dec 2020 | $352M | $22.8M | 6.5% |
| Nov 2020 | $344M | $23.5M | 6.8% |
| Oct 2020 | $377M | $13.6M | 3.6% |
| Sep 2020 | $315M | $11.0M | 3.5% |
| Aug 2020 | $305M | $11.0M | 3.6% |
| Jul 2020 | $113M | $5.8M | 5.1% |
| Jun 2020 | $61.7M | $2.3M | 3.7% |
| Mar 2020 | $88.9M | $3.8M | 4.3% |
| Feb 2020 | $219M | $9.9M | 4.5% |
| Jan 2020 | $246M | $11.2M | 4.6% |
| Year | Handle | Revenue (GGR) |
|---|---|---|
| 2026 | $3.42B (8 mo) | $272M (8 mo) |
| 2025 | $5.75B | $400M |
| 2024 | $5.23B | $286M |
| 2023 | $5.44B | $241M |
| 2022 | $5.94B | $203M |
| 2021 | $5.25B | $194M |
| 2020 | $2.42B (10 mo) | $115M (10 mo) |
Years with missing months show partial totals, marked with the number of months reported.
Notes
GGR is the "*** Sports - Mobile" informational win line. NGCB began printing a separate mobile-only win line in its January 2020 monthly report; no earlier report breaks out mobile from retail, so this series starts there (see sports_retail for the combined pre-2020 figures). tax_paid is permanently blank, for the same reason as the retail series. handle is derived as mobile win / mobile win percent, since NGCB prints no wagers; see sports_retail.
Sources
Related charts
Same chart for other states
Arizona · Arkansas · Colorado · Connecticut · District of Columbia · Illinois · Indiana · Iowa · Kansas · Kentucky · Louisiana · Maine · Maryland · Massachusetts · Michigan · New Hampshire · New Jersey · New York · North Carolina · Ohio · Pennsylvania · Rhode Island · Tennessee · Vermont · Virginia · Wyoming