States / Rhode Island / Chart
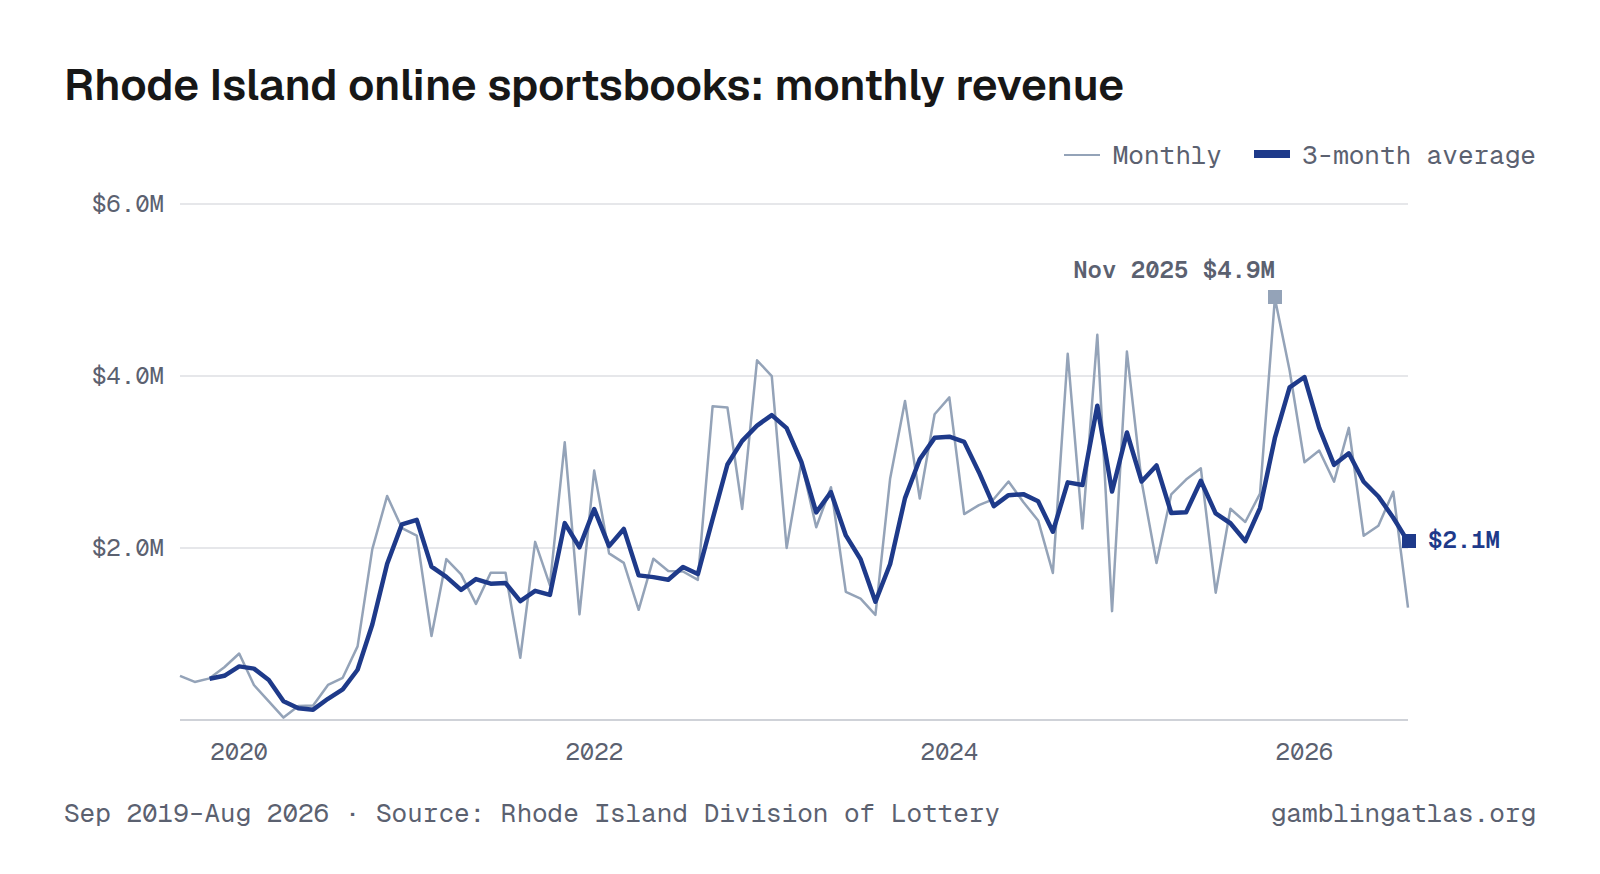
Rhode Island Online Sports Betting Revenue and Handle by Month
Rhode Island online sportsbooks produced $1.3M in gross gaming revenue in August 2026, down 47% from Aug 2025. Over the 12 months through Aug 2026, revenue totaled $34.6M on $365M in bets, a 9.5% hold. In the shared comparison window Sep 2025–Aug 2026, it ranked 22nd largest of 25 states with monthly online sports betting revenue.
The highest month on record here is Nov 2025 ($4.9M). Monthly figures run from Sep 2019 to Aug 2026 and come from the Rhode Island Division of Lottery.
Sep 2019–Aug 2026 · Source: Rhode Island Division of Lottery · Rhode Island revenue
Handle (amount bet)
Download, embed or cite
Free to reuse with a link to this page. License and sources
Data
| Month | Handle | Revenue (GGR) | Hold |
|---|---|---|---|
| Aug 2026 | $22.2M | $1.3M | 5.9% |
| Jul 2026 | $21.7M | $2.7M | 12.2% |
| Jun 2026 | $27.6M | $2.3M | 8.2% |
| May 2026 | $27.0M | $2.1M | 7.9% |
| Apr 2026 | $28.4M | $3.4M | 12.0% |
| Mar 2026 | $31.6M | $2.8M | 8.8% |
| Feb 2026 | $26.0M | $3.1M | 12.0% |
| Jan 2026 | $34.9M | $3.0M | 8.6% |
| Dec 2025 | $33.0M | $4.1M | 12.3% |
| Nov 2025 | $40.9M | $4.9M | 12.0% |
| Oct 2025 | $37.9M | $2.6M | 6.9% |
| Sep 2025 | $33.4M | $2.3M | 6.9% |
| Aug 2025 | $23.7M | $2.5M | 10.4% |
| Jul 2025 | $20.1M | $1.5M | 7.4% |
| Jun 2025 | $24.1M | $2.9M | 12.1% |
| May 2025 | $31.1M | $2.8M | 9.0% |
| Apr 2025 | $32.1M | $2.6M | 8.2% |
| Mar 2025 | $38.0M | $1.8M | 4.8% |
| Feb 2025 | $29.7M | $2.8M | 9.3% |
| Jan 2025 | $39.1M | $4.3M | 10.9% |
| Dec 2024 | $41.8M | $1.3M | 3.0% |
| Nov 2024 | $40.1M | $4.5M | 11.2% |
| Oct 2024 | $39.8M | $2.2M | 5.6% |
| Sep 2024 | $34.6M | $4.3M | 12.3% |
| Aug 2024 | $23.6M | $1.7M | 7.2% |
| Jul 2024 | $21.0M | $2.3M | 11.0% |
| Jun 2024 | $27.0M | $2.5M | 9.4% |
| May 2024 | $30.5M | $2.8M | 9.1% |
| Apr 2024 | $31.4M | $2.6M | 8.2% |
| Mar 2024 | $37.0M | $2.5M | 6.7% |
| Feb 2024 | $30.4M | $2.4M | 7.9% |
| Jan 2024 | $34.8M | $3.8M | 10.8% |
| Dec 2023 | $39.1M | $3.6M | 9.1% |
| Nov 2023 | $38.6M | $2.6M | 6.7% |
| Oct 2023 | $36.4M | $3.7M | 10.2% |
| Sep 2023 | $28.7M | $2.8M | 9.8% |
| Aug 2023 | $17.7M | $1.2M | 6.9% |
| Jul 2023 | $15.4M | $1.4M | 9.2% |
| Jun 2023 | $17.3M | $1.5M | 8.6% |
| May 2023 | $22.4M | $2.7M | 12.1% |
| Apr 2023 | $27.5M | $2.2M | 8.1% |
| Mar 2023 | $30.0M | $3.0M | 10.0% |
| Feb 2023 | $28.5M | $2.0M | 7.0% |
| Jan 2023 | $37.5M | $4.0M | 10.7% |
| Dec 2022 | $36.7M | $4.2M | 11.4% |
| Nov 2022 | $37.0M | $2.5M | 6.6% |
| Oct 2022 | $34.3M | $3.6M | 10.6% |
| Sep 2022 | $26.8M | $3.6M | 13.6% |
| Aug 2022 | $17.9M | $1.6M | 9.1% |
| Jul 2022 | $16.0M | $1.7M | 10.8% |
| Jun 2022 | $20.9M | $1.7M | 8.3% |
| May 2022 | $25.3M | $1.9M | 7.4% |
| Apr 2022 | $25.5M | $1.3M | 5.0% |
| Mar 2022 | $27.1M | $1.8M | 6.7% |
| Feb 2022 | $23.4M | $1.9M | 8.3% |
| Jan 2022 | $33.5M | $2.9M | 8.7% |
| Dec 2021 | $31.0M | $1.2M | 4.0% |
| Nov 2021 | $28.7M | $3.2M | 11.2% |
| Oct 2021 | $31.1M | $1.6M | 5.0% |
| Sep 2021 | $21.1M | $2.1M | 9.8% |
| Aug 2021 | $11.8M | $723K | 6.1% |
| Jul 2021 | $11.1M | $1.7M | 15.4% |
| Jun 2021 | $14.6M | $1.7M | 11.7% |
| May 2021 | $14.6M | $1.4M | 9.2% |
| Apr 2021 | $16.1M | $1.7M | 10.5% |
| Mar 2021 | $21.2M | $1.9M | 8.8% |
| Feb 2021 | $17.8M | $976K | 5.5% |
| Jan 2021 | $21.9M | $2.1M | 9.8% |
| Dec 2020 | $18.3M | $2.2M | 12.2% |
| Nov 2020 | $15.7M | $2.6M | 16.6% |
| Oct 2020 | $15.4M | $2.0M | 12.9% |
| Sep 2020 | $14.1M | $856K | 6.1% |
| Aug 2020 | $10.4M | $491K | 4.7% |
| Jul 2020 | $4.4M | $407K | 9.3% |
| Jun 2020 | $2.1M | $169K | 8.1% |
| May 2020 | $1.5M | $162K | 10.6% |
| Apr 2020 | $589K | $28.2K | 4.8% |
| Mar 2020 | $3.1M | $216K | 7.0% |
| Feb 2020 | $8.5M | $407K | 4.8% |
| Jan 2020 | $7.8M | $773K | 9.9% |
| Dec 2019 | $8.8M | $614K | 7.0% |
| Nov 2019 | $8.4M | $484K | 5.8% |
| Oct 2019 | $5.9M | $443K | 7.6% |
| Sep 2019 | $3.3M | $513K | 15.6% |
| Year | Handle | Revenue (GGR) |
|---|---|---|
| 2026 | $220M (8 mo) | $20.7M (8 mo) |
| 2025 | $383M | $35.1M |
| 2024 | $392M | $32.8M |
| 2023 | $339M | $30.7M |
| 2022 | $324M | $28.8M |
| 2021 | $241M | $20.3M |
| 2020 | $102M | $10.3M |
| 2019 | $26.3M (4 mo) | $2.1M (4 mo) |
Years with missing months show partial totals, marked with the number of months reported.
| Operator | Handle | GGR |
|---|---|---|
| Bally's Corporation | $365M | $34.6M |
License-holder totals may include partner-operated brands.
Notes
GGR is the Lottery's printed book revenue (write minus payouts), before commissions or expenses. The Lottery runs sports betting; the state's share is not printed in this report.
Sources
Related charts
Same chart for other states
Arizona · Arkansas · Colorado · Connecticut · District of Columbia · Illinois · Indiana · Iowa · Kansas · Kentucky · Louisiana · Maine · Maryland · Massachusetts · Michigan · Nevada · New Hampshire · New Jersey · New York · North Carolina · Ohio · Pennsylvania · Tennessee · Vermont · Virginia · Wyoming