States / Rhode Island / Chart
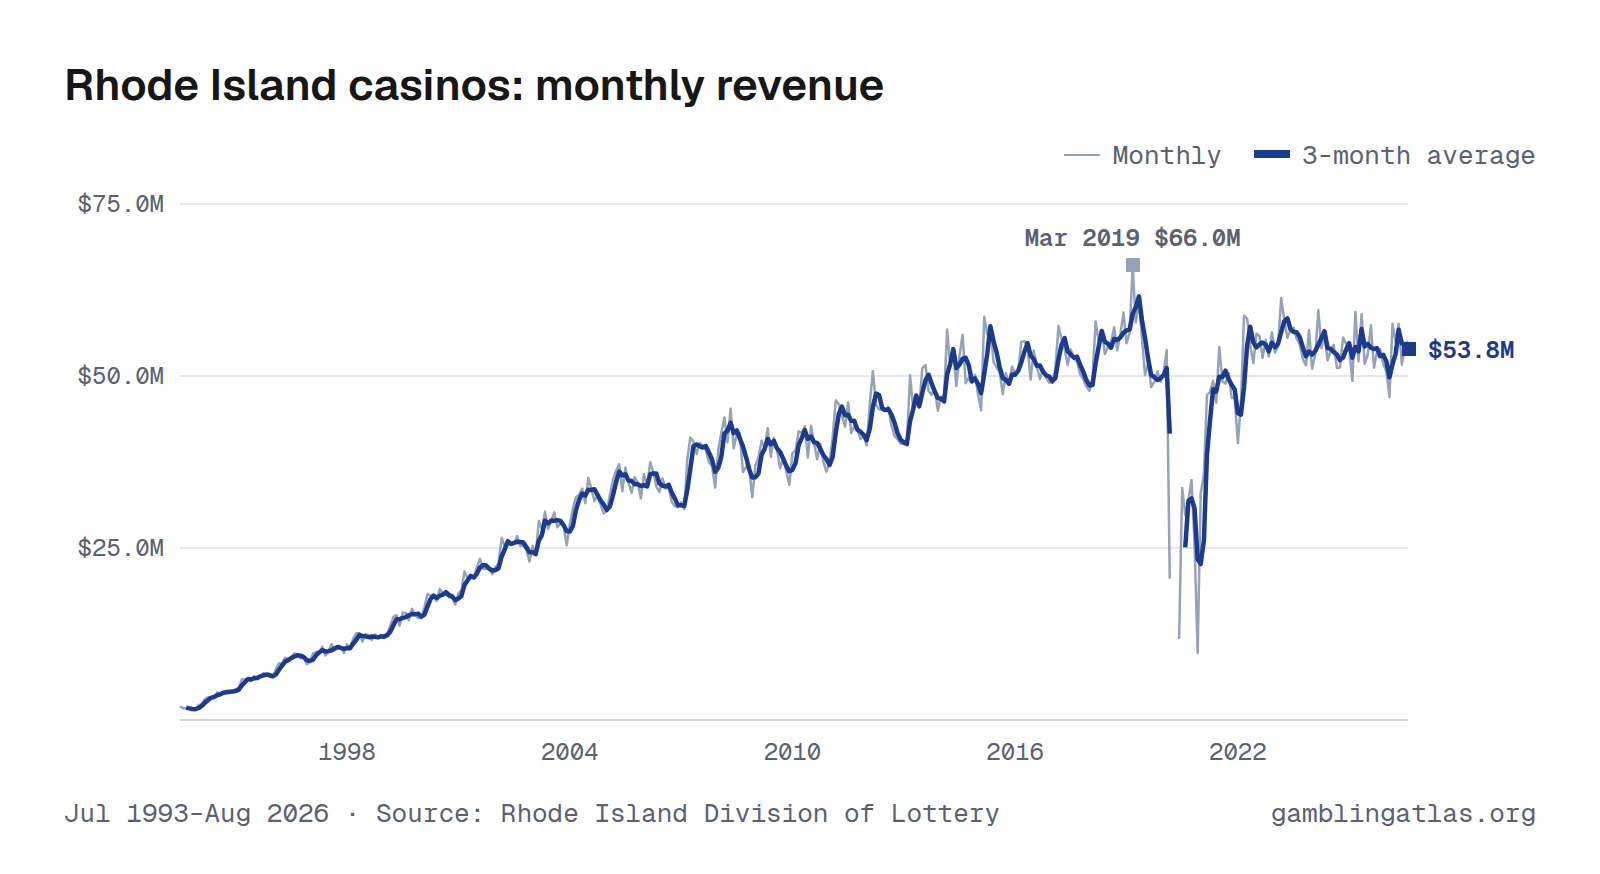
Rhode Island Casino Revenue and Handle by Month
Rhode Island casinos produced $55.1M in gross gaming revenue in August 2026, down 4% from Aug 2025. Over the 12 months through Aug 2026, revenue totaled $640M on $4.35B in bets, a 14.7% hold. In the shared comparison window Sep 2025–Aug 2026, it ranked 18th largest of 25 states with monthly casino revenue.
The highest month on record here is Mar 2019 ($66.0M). Monthly figures run from Jul 1993 to Aug 2026 and come from the Rhode Island Division of Lottery.
Jul 1993–Aug 2026 · Source: Rhode Island Division of Lottery · Rhode Island revenue
Handle (amount bet)
Download, embed or cite
Free to reuse with a link to this page. License and sources
Data
| Month | Handle | Revenue (GGR) | Hold |
|---|---|---|---|
| Aug 2026 | $386M | $55.1M | 14.3% |
| Jul 2026 | $388M | $54.6M | 14.1% |
| Jun 2026 | $360M | $51.6M | 14.4% |
| May 2026 | $408M | $57.6M | 14.1% |
| Apr 2026 | $366M | $55.0M | 15.0% |
| Mar 2026 | $390M | $57.6M | 14.8% |
| Feb 2026 | $319M | $46.9M | 14.7% |
| Jan 2026 | $338M | $50.7M | 15.0% |
| Dec 2025 | $340M | $51.8M | 15.2% |
| Nov 2025 | $353M | $53.9M | 15.3% |
| Oct 2025 | $356M | $53.5M | 15.0% |
| Sep 2025 | $342M | $51.2M | 15.0% |
| Aug 2025 | $388M | $57.4M | 14.8% |
| Jul 2025 | $366M | $53.2M | 14.5% |
| Jun 2025 | $349M | $51.8M | 14.8% |
| May 2025 | $381M | $59.0M | 15.5% |
| Apr 2025 | $356M | $52.1M | 14.6% |
| Mar 2025 | $387M | $59.3M | 15.3% |
| Feb 2025 | $316M | $49.3M | 15.6% |
| Jan 2025 | $342M | $54.0M | 15.8% |
| Dec 2024 | $347M | $54.6M | 15.7% |
| Nov 2024 | $350M | $55.6M | 15.9% |
| Oct 2024 | $348M | $51.2M | 14.7% |
| Sep 2024 | $345M | $51.2M | 14.8% |
| Aug 2024 | $370M | $54.5M | 14.8% |
| Jul 2024 | $361M | $53.7M | 14.9% |
| Jun 2024 | $353M | $52.3M | 14.8% |
| May 2024 | $378M | $55.9M | 14.8% |
| Apr 2024 | $360M | $54.0M | 15.0% |
| Mar 2024 | $381M | $59.6M | 15.6% |
| Feb 2024 | $343M | $53.0M | 15.5% |
| Jan 2024 | $319M | $51.1M | 16.0% |
| Dec 2023 | $354M | $56.7M | 16.0% |
| Nov 2023 | $329M | $51.6M | 15.7% |
| Oct 2023 | $340M | $52.4M | 15.4% |
| Sep 2023 | $347M | $54.6M | 15.7% |
| Aug 2023 | $357M | $55.4M | 15.5% |
| Jul 2023 | $375M | $57.0M | 15.2% |
| Jun 2023 | $370M | $56.7M | 15.3% |
| May 2023 | $373M | $55.5M | 14.9% |
| Apr 2023 | $381M | $58.2M | 15.3% |
| Mar 2023 | $393M | $61.3M | 15.6% |
| Feb 2023 | $345M | $54.4M | 15.8% |
| Jan 2023 | $355M | $53.4M | 15.1% |
| Dec 2022 | $352M | $56.3M | 16.0% |
| Nov 2022 | $331M | $52.8M | 16.0% |
| Oct 2022 | $349M | $55.3M | 15.8% |
| Sep 2022 | $336M | $52.6M | 15.7% |
| Aug 2022 | $350M | $55.8M | 16.0% |
| Jul 2022 | $366M | $56.2M | 15.3% |
| Jun 2022 | $343M | $51.9M | 15.1% |
| May 2022 | $368M | $54.4M | 14.8% |
| Apr 2022 | $386M | $58.3M | 15.1% |
| Mar 2022 | $388M | $58.8M | 15.1% |
| Feb 2022 | $317M | $46.3M | 14.6% |
| Jan 2022 | $273M | $40.2M | 14.8% |
| Dec 2021 | $304M | $46.7M | 15.4% |
| Nov 2021 | $307M | $46.9M | 15.3% |
| Oct 2021 | $340M | $50.5M | 14.8% |
| Sep 2021 | $323M | $48.9M | 15.1% |
| Aug 2021 | $334M | $49.2M | 14.7% |
| Jul 2021 | $368M | $54.2M | 14.7% |
| Jun 2021 | $329M | $46.1M | 14.0% |
| May 2021 | $336M | $49.3M | 14.7% |
| Apr 2021 | $310M | $47.7M | 15.4% |
| Mar 2021 | $300M | $47.2M | 15.7% |
| Feb 2021 | $221M | $35.8M | 16.2% |
| Jan 2021 | $226M | $32.9M | 14.6% |
| Dec 2020 | $59.8M | $9.8M | 16.3% |
| Nov 2020 | $169M | $25.4M | 15.0% |
| Oct 2020 | $225M | $34.9M | 15.5% |
| Sep 2020 | $205M | $32.0M | 15.6% |
| Aug 2020 | $185M | $29.8M | 16.1% |
| Jul 2020 | $201M | $33.7M | 16.8% |
| Jun 2020 | $80.7M | $11.8M | 14.6% |
| Mar 2020 | $123M | $20.5M | 16.7% |
| Feb 2020 | $327M | $53.8M | 16.5% |
| Jan 2020 | $319M | $50.5M | 15.9% |
| Dec 2019 | $300M | $49.2M | 16.4% |
| Nov 2019 | $302M | $50.7M | 16.8% |
| Oct 2019 | $300M | $49.2M | 16.4% |
| Sep 2019 | $302M | $48.4M | 16.0% |
| Aug 2019 | $321M | $51.9M | 16.2% |
| Jul 2019 | $308M | $50.1M | 16.3% |
| Jun 2019 | $321M | $55.4M | 17.3% |
| May 2019 | $342M | $60.9M | 17.8% |
| Apr 2019 | $325M | $57.8M | 17.8% |
| Mar 2019 | $360M | $66.0M | 18.3% |
| Feb 2019 | $301M | $56.3M | 18.7% |
| Jan 2019 | $288M | $54.8M | 19.0% |
| Dec 2018 | $318M | $59.2M | 18.7% |
| Nov 2018 | $294M | $55.9M | 19.0% |
| Oct 2018 | $288M | $53.7M | 18.7% |
| Sep 2018 | $314M | $57.1M | 18.2% |
| Aug 2018 | $301M | $54.8M | 18.2% |
| Jul 2018 | $299M | $54.2M | 18.1% |
| Jun 2018 | $284M | $53.2M | 18.8% |
| May 2018 | $294M | $56.7M | 19.3% |
| Apr 2018 | $297M | $55.1M | 18.6% |
| Mar 2018 | $304M | $57.9M | 19.0% |
| Feb 2018 | $265M | $49.8M | 18.8% |
| Jan 2018 | $252M | $47.9M | 19.0% |
| Dec 2017 | $254M | $48.5M | 19.1% |
| Nov 2017 | $256M | $49.5M | 19.4% |
| Oct 2017 | $263M | $50.3M | 19.1% |
| Sep 2017 | $273M | $52.1M | 19.1% |
| Aug 2017 | $279M | $52.5M | 18.8% |
| Jul 2017 | $297M | $53.9M | 18.2% |
| Jun 2017 | $269M | $51.6M | 19.2% |
| May 2017 | $282M | $53.9M | 19.1% |
| Apr 2017 | $291M | $55.3M | 19.0% |
| Mar 2017 | $294M | $57.3M | 19.5% |
| Feb 2017 | $261M | $51.0M | 19.6% |
| Jan 2017 | $258M | $49.0M | 19.0% |
| Dec 2016 | $251M | $49.1M | 19.5% |
| Nov 2016 | $258M | $49.7M | 19.3% |
| Oct 2016 | $272M | $51.0M | 18.8% |
| Sep 2016 | $266M | $49.6M | 18.6% |
| Aug 2016 | $272M | $51.3M | 18.9% |
| Jul 2016 | $296M | $53.7M | 18.1% |
| Jun 2016 | $273M | $49.5M | 18.1% |
| May 2016 | $293M | $54.3M | 18.5% |
| Apr 2016 | $287M | $55.1M | 19.2% |
| Mar 2016 | $280M | $55.0M | 19.6% |
| Feb 2016 | $259M | $50.7M | 19.5% |
| Jan 2016 | $261M | $50.3M | 19.3% |
| Dec 2015 | $263M | $51.4M | 19.6% |
| Nov 2015 | $257M | $48.9M | 19.0% |
| Oct 2015 | $265M | $50.4M | 19.0% |
| Sep 2015 | $257M | $47.4M | 18.4% |
| Aug 2015 | $280M | $50.5M | 18.1% |
| Jul 2015 | $284M | $51.3M | 18.1% |
| Jun 2015 | $289M | $52.0M | 18.0% |
| May 2015 | $317M | $57.0M | 18.0% |
| Apr 2015 | $302M | $56.1M | 18.6% |
| Mar 2015 | $310M | $58.6M | 18.9% |
| Feb 2015 | $237M | $45.0M | 19.0% |
| Jan 2015 | $251M | $47.3M | 18.8% |
| Dec 2014 | $266M | $50.2M | 18.9% |
| Nov 2014 | $265M | $49.0M | 18.5% |
| Oct 2014 | $278M | $49.8M | 17.9% |
| Sep 2014 | $273M | $49.0M | 17.9% |
| Aug 2014 | $309M | $56.0M | 18.1% |
| Jul 2014 | $291M | $53.0M | 18.2% |
| Jun 2014 | $271M | $48.5M | 17.9% |
| May 2014 | $294M | $53.5M | 18.2% |
| Apr 2014 | $277M | $51.4M | 18.6% |
| Mar 2014 | $304M | $56.7M | 18.7% |
| Feb 2014 | $255M | $47.0M | 18.4% |
| Jan 2014 | $249M | $47.0M | 18.8% |
| Dec 2013 | $246M | $45.0M | 18.3% |
| Nov 2013 | $264M | $48.2M | 18.2% |
| Oct 2013 | $262M | $47.2M | 18.0% |
| Sep 2013 | $267M | $47.8M | 17.9% |
| Aug 2013 | $295M | $51.6M | 17.5% |
| Jul 2013 | $297M | $51.1M | 17.2% |
| Jun 2013 | $288M | $45.4M | 15.8% |
| May 2013 | $302M | $46.2M | 15.3% |
| Apr 2013 | $303M | $45.2M | 14.9% |
| Mar 2013 | $328M | $50.1M | 15.3% |
| Feb 2013 | $263M | $40.0M | 15.2% |
| Jan 2013 | $271M | $40.1M | 14.8% |
| Dec 2012 | $271M | $40.1M | 14.8% |
| Nov 2012 | $274M | $40.8M | 14.9% |
| Oct 2012 | $272M | $41.3M | 15.2% |
| Sep 2012 | $282M | $42.8M | 15.2% |
| Aug 2012 | $296M | $45.5M | 15.4% |
| Jul 2012 | $295M | $45.0M | 15.2% |
| Jun 2012 | $287M | $45.1M | 15.7% |
| May 2012 | $292M | $45.2M | 15.4% |
| Apr 2012 | $290M | $45.8M | 15.8% |
| Mar 2012 | $307M | $50.7M | 16.5% |
| Feb 2012 | $282M | $45.8M | 16.3% |
| Jan 2012 | $253M | $39.9M | 15.7% |
| Dec 2011 | $255M | $41.3M | 16.2% |
| Nov 2011 | $250M | $40.8M | 16.4% |
| Oct 2011 | $262M | $42.2M | 16.1% |
| Sep 2011 | $263M | $42.7M | 16.3% |
| Aug 2011 | $259M | $41.7M | 16.1% |
| Jul 2011 | $283M | $46.1M | 16.3% |
| Jun 2011 | $251M | $42.7M | 17.0% |
| May 2011 | $273M | $44.3M | 16.2% |
| Apr 2011 | $273M | $45.9M | 16.8% |
| Mar 2011 | $270M | $46.5M | 17.2% |
| Feb 2011 | $238M | $41.1M | 17.3% |
| Jan 2011 | $223M | $37.6M | 16.8% |
| Dec 2010 | $215M | $36.1M | 16.8% |
| Nov 2010 | $219M | $37.5M | 17.2% |
| Oct 2010 | $234M | $40.1M | 17.1% |
| Sep 2010 | $219M | $37.9M | 17.3% |
| Aug 2010 | $234M | $40.2M | 17.2% |
| Jul 2010 | $247M | $42.8M | 17.3% |
| Jun 2010 | $219M | $38.1M | 17.4% |
| May 2010 | $240M | $42.7M | 17.8% |
| Apr 2010 | $231M | $41.7M | 18.1% |
| Mar 2010 | $228M | $42.0M | 18.4% |
| Feb 2010 | $209M | $39.2M | 18.8% |
| Jan 2010 | $211M | $38.7M | 18.3% |
| Dec 2009 | $185M | $34.2M | 18.5% |
| Nov 2009 | $197M | $36.2M | 18.3% |
| Oct 2009 | $204M | $38.1M | 18.7% |
| Sep 2009 | $192M | $36.6M | 19.0% |
| Aug 2009 | $211M | $39.3M | 18.6% |
| Jul 2009 | $214M | $41.0M | 19.1% |
| Jun 2009 | $202M | $38.3M | 18.9% |
| May 2009 | $222M | $42.4M | 19.1% |
| Apr 2009 | $200M | $39.5M | 19.8% |
| Mar 2009 | $204M | $40.6M | 19.9% |
| Feb 2009 | $192M | $38.1M | 19.8% |
| Jan 2009 | $187M | $36.9M | 19.8% |
| Dec 2008 | $161M | $32.4M | 20.1% |
| Nov 2008 | $184M | $36.5M | 19.8% |
| Oct 2008 | $184M | $36.8M | 20.0% |
| Sep 2008 | $178M | $36.0M | 20.2% |
| Aug 2008 | $206M | $41.7M | 20.3% |
| Jul 2008 | $201M | $41.6M | 20.7% |
| Jun 2008 | $191M | $39.5M | 20.7% |
| May 2008 | $211M | $45.2M | 21.4% |
| Apr 2008 | $188M | $40.4M | 21.5% |
| Mar 2008 | $202M | $44.0M | 21.8% |
| Feb 2008 | $190M | $41.8M | 22.0% |
| Jan 2008 | $178M | $39.2M | 22.0% |
| Dec 2007 | $152M | $33.8M | 22.3% |
| Nov 2007 | $161M | $37.0M | 23.0% |
| Oct 2007 | $164M | $37.5M | 22.8% |
| Sep 2007 | $171M | $39.3M | 23.0% |
| Aug 2007 | $173M | $39.9M | 23.1% |
| Jul 2007 | $175M | $40.3M | 23.1% |
| Jun 2007 | $166M | $38.6M | 23.3% |
| May 2007 | $170M | $40.5M | 23.9% |
| Apr 2007 | $169M | $41.1M | 24.3% |
| Mar 2007 | $143M | $37.8M | 26.4% |
| Feb 2007 | $110M | $30.7M | 28.0% |
| Jan 2007 | $112M | $31.7M | 28.2% |
| Dec 2006 | $109M | $30.9M | 28.3% |
| Nov 2006 | $110M | $31.1M | 28.3% |
| Oct 2006 | $111M | $31.7M | 28.5% |
| Sep 2006 | $118M | $33.8M | 28.6% |
| Aug 2006 | $119M | $33.6M | 28.3% |
| Jul 2006 | $124M | $35.1M | 28.3% |
| Jun 2006 | $118M | $33.1M | 28.1% |
| May 2006 | $121M | $33.9M | 27.9% |
| Apr 2006 | $127M | $36.1M | 28.3% |
| Mar 2006 | $133M | $37.5M | 28.2% |
| Feb 2006 | $118M | $34.0M | 28.7% |
| Jan 2006 | $125M | $35.8M | 28.6% |
| Dec 2005 | $115M | $32.2M | 28.1% |
| Nov 2005 | $120M | $34.5M | 28.8% |
| Oct 2005 | $123M | $35.3M | 28.7% |
| Sep 2005 | $118M | $33.0M | 28.0% |
| Aug 2005 | $123M | $34.5M | 28.0% |
| Jul 2005 | $129M | $36.7M | 28.4% |
| Jun 2005 | $117M | $33.2M | 28.4% |
| May 2005 | $131M | $37.2M | 28.5% |
| Apr 2005 | $126M | $36.2M | 28.7% |
| Mar 2005 | $123M | $34.9M | 28.4% |
| Feb 2005 | $114M | $32.8M | 28.7% |
| Jan 2005 | $105M | $30.3M | 29.0% |
| Dec 2004 | $106M | $30.0M | 28.3% |
| Nov 2004 | $110M | $31.2M | 28.5% |
| Oct 2004 | $114M | $32.6M | 28.7% |
| Sep 2004 | $110M | $31.8M | 28.8% |
| Aug 2004 | $117M | $33.6M | 28.7% |
| Jul 2004 | $123M | $35.2M | 28.6% |
| Jun 2004 | $109M | $31.5M | 29.0% |
| May 2004 | $116M | $33.6M | 29.0% |
| Apr 2004 | $112M | $32.7M | 29.2% |
| Mar 2004 | $112M | $32.3M | 28.8% |
| Feb 2004 | $107M | $30.7M | 28.7% |
| Jan 2004 | $98.3M | $28.4M | 28.9% |
| Dec 2003 | $86.9M | $25.4M | 29.2% |
| Nov 2003 | $97.0M | $28.3M | 29.2% |
| Oct 2003 | $97.5M | $28.6M | 29.4% |
| Sep 2003 | $96.3M | $28.0M | 29.1% |
| Aug 2003 | $102M | $30.2M | 29.5% |
| Jul 2003 | $96.4M | $29.0M | 30.0% |
| Jun 2003 | $93.3M | $27.8M | 29.8% |
| May 2003 | $100M | $30.3M | 30.1% |
| Apr 2003 | $92.2M | $27.7M | 30.1% |
| Mar 2003 | $95.1M | $28.9M | 30.4% |
| Feb 2003 | $78.9M | $24.0M | 30.4% |
| Jan 2003 | $84.8M | $25.3M | 29.9% |
| Dec 2002 | $77.0M | $23.1M | 30.0% |
| Nov 2002 | $83.3M | $24.7M | 29.7% |
| Oct 2002 | $85.7M | $25.3M | 29.6% |
| Sep 2002 | $83.9M | $25.3M | 30.2% |
| Aug 2002 | $89.2M | $26.7M | 30.0% |
| Jul 2002 | $87.6M | $25.6M | 29.2% |
| Jun 2002 | $83.9M | $25.4M | 30.3% |
| May 2002 | $86.4M | $26.2M | 30.3% |
| Apr 2002 | $83.0M | $25.2M | 30.3% |
| Mar 2002 | $87.2M | $26.5M | 30.4% |
| Feb 2002 | $75.3M | $22.8M | 30.3% |
| Jan 2002 | $73.6M | $22.2M | 30.2% |
| Dec 2001 | $71.8M | $21.2M | 29.5% |
| Nov 2001 | $74.0M | $22.0M | 29.7% |
| Oct 2001 | $74.5M | $22.0M | 29.5% |
| Sep 2001 | $73.7M | $21.9M | 29.7% |
| Aug 2001 | $78.0M | $23.4M | 30.0% |
| Jul 2001 | $73.9M | $22.2M | 30.0% |
| Jun 2001 | $69.4M | $20.9M | 30.1% |
| May 2001 | $68.9M | $20.7M | 30.1% |
| Apr 2001 | $67.8M | $20.5M | 30.3% |
| Mar 2001 | $72.3M | $21.6M | 29.8% |
| Feb 2001 | $63.4M | $18.9M | 29.8% |
| Jan 2001 | $62.2M | $18.4M | 29.6% |
| Dec 2000 | $56.6M | $16.8M | 29.6% |
| Nov 2000 | $60.2M | $17.8M | 29.5% |
| Oct 2000 | $61.0M | $17.8M | 29.2% |
| Sep 2000 | $61.9M | $18.3M | 29.6% |
| Aug 2000 | $62.4M | $18.3M | 29.4% |
| Jul 2000 | $65.0M | $19.1M | 29.3% |
| Jun 2000 | $58.4M | $17.3M | 29.6% |
| May 2000 | $61.1M | $17.9M | 29.3% |
| Apr 2000 | $61.7M | $18.1M | 29.3% |
| Mar 2000 | $62.9M | $18.3M | 29.1% |
| Feb 2000 | $55.5M | $16.3M | 29.4% |
| Jan 2000 | $51.8M | $14.8M | 28.6% |
| Dec 1999 | $51.5M | $14.8M | 28.7% |
| Nov 1999 | $52.9M | $15.4M | 29.1% |
| Oct 1999 | $55.1M | $16.2M | 29.3% |
| Sep 1999 | $50.8M | $14.5M | 28.5% |
| Aug 1999 | $54.1M | $15.6M | 28.8% |
| Jul 1999 | $54.8M | $15.6M | 28.5% |
| Jun 1999 | $47.4M | $13.7M | 28.9% |
| May 1999 | $52.5M | $15.2M | 29.0% |
| Apr 1999 | $52.4M | $15.0M | 28.6% |
| Mar 1999 | $49.2M | $13.7M | 27.9% |
| Feb 1999 | $43.8M | $12.6M | 28.7% |
| Jan 1999 | $43.3M | $12.2M | 28.3% |
| Dec 1998 | $42.4M | $12.1M | 28.5% |
| Nov 1998 | $42.4M | $12.0M | 28.2% |
| Oct 1998 | $44.1M | $12.4M | 28.1% |
| Sep 1998 | $40.6M | $11.7M | 28.7% |
| Aug 1998 | $43.3M | $12.2M | 28.3% |
| Jul 1998 | $44.1M | $12.5M | 28.3% |
| Jun 1998 | $41.4M | $11.4M | 27.5% |
| May 1998 | $44.6M | $12.6M | 28.3% |
| Apr 1998 | $41.8M | $12.6M | 30.2% |
| Mar 1998 | $41.2M | $11.8M | 28.7% |
| Feb 1998 | $37.1M | $10.5M | 28.4% |
| Jan 1998 | $38.2M | $11.0M | 28.7% |
| Dec 1997 | $34.5M | $9.7M | 28.2% |
| Nov 1997 | $36.2M | $10.6M | 29.3% |
| Oct 1997 | $37.3M | $10.7M | 28.6% |
| Sep 1997 | $35.3M | $10.1M | 28.8% |
| Aug 1997 | $39.2M | $11.0M | 28.2% |
| Jul 1997 | $37.2M | $10.0M | 26.8% |
| Jun 1997 | $34.3M | $9.4M | 27.3% |
| May 1997 | $39.0M | $10.6M | 27.3% |
| Apr 1997 | $35.1M | $9.9M | 28.1% |
| Mar 1997 | $35.6M | $9.9M | 27.9% |
| Feb 1997 | $32.7M | $9.7M | 29.5% |
| Jan 1997 | $32.5M | $8.6M | 26.4% |
| Dec 1996 | $29.5M | $8.1M | 27.4% |
| Nov 1996 | $32.7M | $9.1M | 27.8% |
| Oct 1996 | $32.7M | $9.0M | 27.4% |
| Sep 1996 | $33.5M | $9.4M | 28.1% |
| Aug 1996 | $35.1M | $9.7M | 27.6% |
| Jul 1996 | $33.4M | $9.1M | 27.3% |
| Jun 1996 | $32.1M | $8.9M | 27.8% |
| May 1996 | $33.3M | $9.0M | 27.1% |
| Apr 1996 | $30.1M | $8.1M | 27.1% |
| Mar 1996 | $30.2M | $8.3M | 27.3% |
| Feb 1996 | $26.6M | $7.4M | 27.6% |
| Jan 1996 | $22.4M | $6.3M | 27.9% |
| Dec 1995 | $23.0M | $6.3M | 27.2% |
| Nov 1995 | $24.1M | $6.5M | 27.1% |
| Oct 1995 | $24.7M | $6.8M | 27.6% |
| Sep 1995 | $23.9M | $6.5M | 27.0% |
| Aug 1995 | $22.6M | $6.2M | 27.5% |
| Jul 1995 | $21.9M | $6.4M | 29.2% |
| Jun 1995 | $19.4M | $5.8M | 29.6% |
| May 1995 | $20.2M | $6.1M | 30.0% |
| Apr 1995 | $19.8M | $5.9M | 29.6% |
| Mar 1995 | $19.8M | $5.9M | 29.9% |
| Feb 1995 | $15.8M | $4.7M | 29.6% |
| Jan 1995 | $15.3M | $4.5M | 29.3% |
| Dec 1994 | $13.9M | $4.1M | 29.5% |
| Nov 1994 | $13.7M | $4.1M | 29.6% |
| Oct 1994 | $14.1M | $4.2M | 30.0% |
| Sep 1994 | $13.6M | $4.1M | 29.9% |
| Aug 1994 | $13.2M | $3.8M | 28.9% |
| Jul 1994 | $13.3M | $4.0M | 30.3% |
| Jun 1994 | $11.1M | $3.4M | 30.4% |
| May 1994 | $10.7M | $3.4M | 31.4% |
| Apr 1994 | $9.9M | $3.3M | 33.3% |
| Mar 1994 | $8.7M | $3.0M | 34.5% |
| Feb 1994 | $6.6M | $2.3M | 35.1% |
| Jan 1994 | $6.0M | $2.2M | 35.9% |
| Dec 1993 | $4.3M | $1.6M | 36.9% |
| Nov 1993 | $3.7M | $1.5M | 40.5% |
| Oct 1993 | $3.8M | $1.6M | 42.7% |
| Sep 1993 | $3.8M | $1.7M | 44.4% |
| Aug 1993 | $3.9M | $1.7M | 44.8% |
| Jul 1993 | $4.2M | $1.9M | 45.9% |
| Year | Handle | Revenue (GGR) |
|---|---|---|
| 2026 | $2.96B (8 mo) | $429M (8 mo) |
| 2025 | $4.28B | $647M |
| 2024 | $4.26B | $647M |
| 2023 | $4.32B | $667M |
| 2022 | $4.16B | $639M |
| 2021 | $3.70B | $555M |
| 2020 | $1.89B (10 mo) | $302M (10 mo) |
| 2019 | $3.77B | $651M |
| 2018 | $3.51B | $656M |
| 2017 | $3.28B | $625M |
| 2016 | $3.27B | $619M |
| 2015 | $3.31B | $616M |
| 2014 | $3.33B | $611M |
| 2013 | $3.39B | $558M |
| 2012 | $3.40B | $528M |
| 2011 | $3.10B | $513M |
| 2010 | $2.70B | $477M |
| 2009 | $2.41B | $461M |
| 2008 | $2.27B | $475M |
| 2007 | $1.86B | $448M |
| 2006 | $1.43B | $407M |
| 2005 | $1.44B | $411M |
| 2004 | $1.33B | $384M |
| 2003 | $1.12B | $333M |
| 2002 | $996M | $299M |
| 2001 | $850M | $254M |
| 2000 | $719M | $211M |
| 1999 | $608M | $174M |
| 1998 | $501M | $143M |
| 1997 | $429M | $120M |
| 1996 | $372M | $102M |
| 1995 | $250M | $71.4M |
| 1994 | $135M | $41.8M |
| 1993 | $23.7M (6 mo) | $10.1M (6 mo) |
Years with missing months show partial totals, marked with the number of months reported.
| Operator | Handle | GGR |
|---|---|---|
| Bally's Corporation | $4.35B | $640M |
License-holder totals may include partner-operated brands.
Notes
GGR is the Lottery's VLT "Net Terminal Income" (cash in less cash out) plus its separate table-games "Total Net Table Games Revenue," summed per facility and month. VLT and table-games revenue are published as two separate monthly report families for the same two facilities; the parser combines them into one commercial-casino total. No overall tax or state-share figure is printed for either report. Handle is the VLT report's "Cash In" (currency inserted that period), not total amount wagered/coin-in -- unlike other states' casino handle, it excludes credits replayed from prior wins without a new cash insertion, so RI's hold (GGR/handle) runs well above peer states' for this vertical and is not comparable to them.
Sources
Related charts
Same chart for other states
Colorado · Delaware · Florida · Illinois · Indiana · Iowa · Kansas · Louisiana · Maine · Maryland · Massachusetts · Michigan · Mississippi · Missouri · Nebraska · Nevada · New Jersey · New Mexico · New York · Ohio · Pennsylvania · South Dakota · Virginia · West Virginia