States / South Dakota / Chart
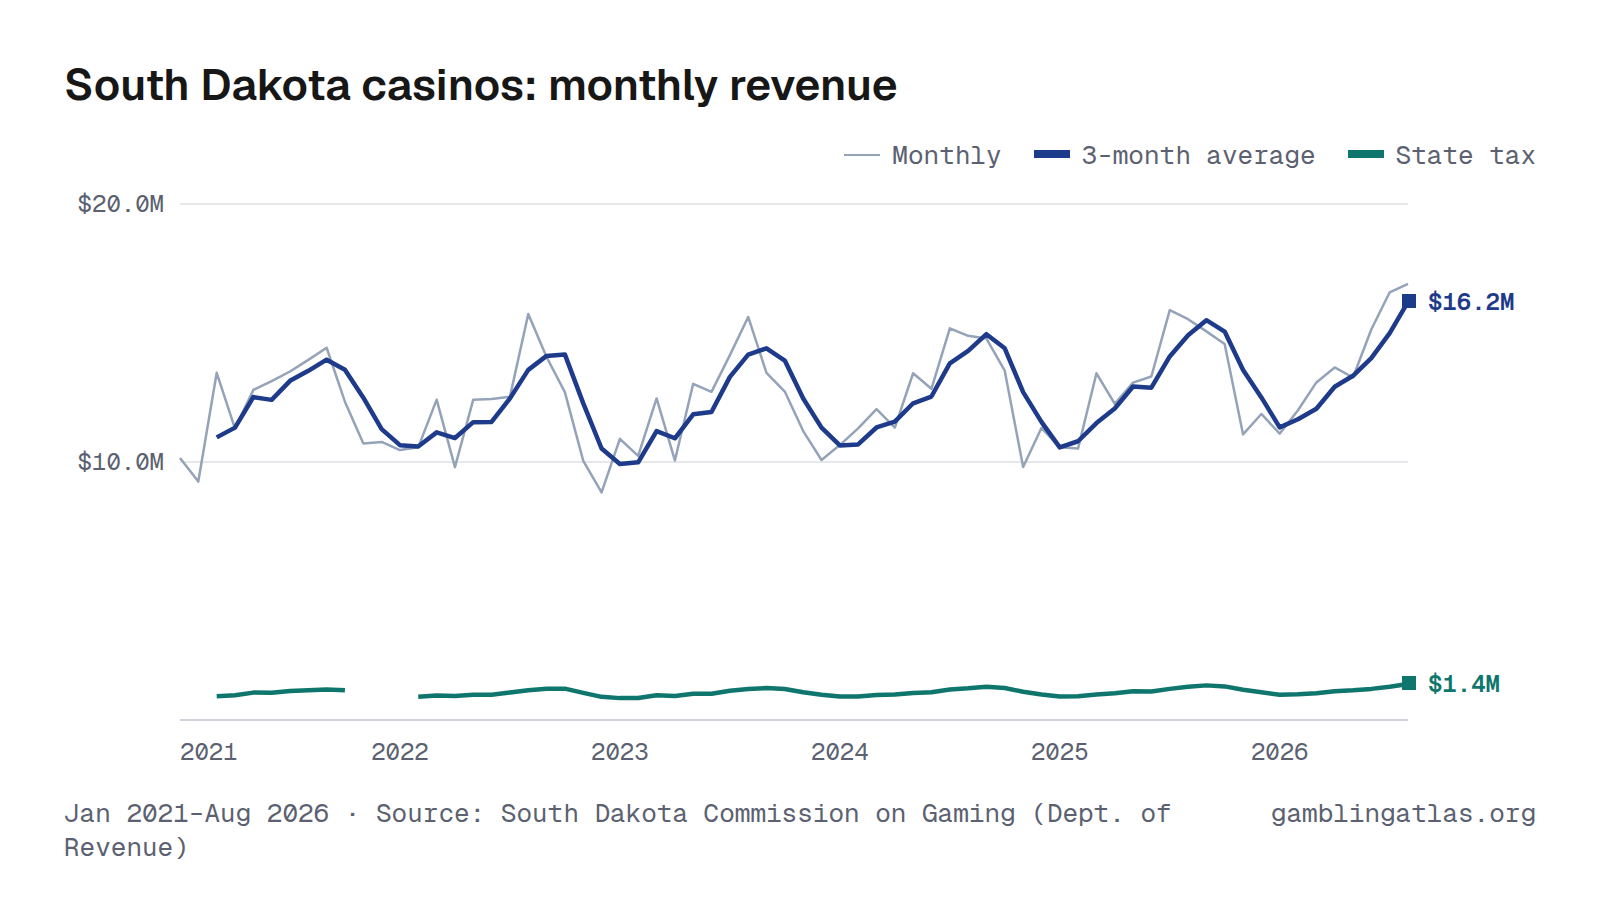
South Dakota Casino Revenue and Handle by Month
South Dakota casinos produced $16.9M in gross gaming revenue in August 2026, up 9% from Aug 2025. Over the 12 months through Aug 2026, revenue totaled $164M on $1.71B in bets, a 9.6% hold, and the state collected $14.1M in tax. In the shared comparison window Sep 2025–Aug 2026, it ranked 24th largest of 25 states with monthly casino revenue.
The highest month on record here is Aug 2026 ($16.9M). Monthly figures run from Jan 2021 to Aug 2026 and come from the South Dakota Commission on Gaming (Dept. of Revenue).
Jan 2021–Aug 2026 · Source: South Dakota Commission on Gaming (Dept. of Revenue) · South Dakota revenue
Handle (amount bet)
Download, embed or cite
Free to reuse with a link to this page. License and sources
Data
| Month | Handle | Revenue (GGR) | Hold | State tax |
|---|---|---|---|---|
| Aug 2026 | $175M | $16.9M | 9.6% | $1.5M |
| Jul 2026 | $173M | $16.6M | 9.6% | $1.4M |
| Jun 2026 | $154M | $15.1M | 9.8% | $1.3M |
| May 2026 | $136M | $13.3M | 9.8% | $1.1M |
| Apr 2026 | $144M | $13.7M | 9.5% | $1.2M |
| Mar 2026 | $144M | $13.1M | 9.1% | $1.1M |
| Feb 2026 | $124M | $12.0M | 9.7% | $1.0M |
| Jan 2026 | $120M | $11.1M | 9.2% | $952K |
| Dec 2025 | $121M | $11.9M | 9.8% | $1.0M |
| Nov 2025 | $114M | $11.1M | 9.7% | $958K |
| Oct 2025 | $155M | $14.6M | 9.4% | $1.2M |
| Sep 2025 | $154M | $15.1M | 9.8% | $1.3M |
| Aug 2025 | $159M | $15.5M | 9.8% | $1.4M |
| Jul 2025 | $166M | $15.9M | 9.6% | $1.4M |
| Jun 2025 | $138M | $13.3M | 9.7% | $1.1M |
| May 2025 | $136M | $13.1M | 9.6% | $1.1M |
| Apr 2025 | $128M | $12.3M | 9.6% | $1.1M |
| Mar 2025 | $132M | $13.4M | 10.1% | $1.2M |
| Feb 2025 | $106M | $10.5M | 10.0% | $896K |
| Jan 2025 | $110M | $10.6M | 9.6% | $906K |
| Dec 2024 | $118M | $11.3M | 9.6% | $964K |
| Nov 2024 | $104M | $9.8M | 9.5% | $853K |
| Oct 2024 | $146M | $13.5M | 9.2% | $1.1M |
| Sep 2024 | $151M | $14.8M | 9.8% | $1.3M |
| Aug 2024 | $158M | $14.9M | 9.4% | $1.3M |
| Jul 2024 | $156M | $15.2M | 9.8% | $1.3M |
| Jun 2024 | $132M | $12.8M | 9.7% | $1.1M |
| May 2024 | $140M | $13.4M | 9.6% | $1.2M |
| Apr 2024 | $117M | $11.3M | 9.7% | $965K |
| Mar 2024 | $126M | $12.0M | 9.6% | $1.0M |
| Feb 2024 | $118M | $11.3M | 9.6% | $964K |
| Jan 2024 | $112M | $10.7M | 9.5% | $916K |
| Dec 2023 | $106M | $10.1M | 9.5% | $864K |
| Nov 2023 | $120M | $11.2M | 9.3% | $955K |
| Oct 2023 | $131M | $12.7M | 9.7% | $1.1M |
| Sep 2023 | $139M | $13.5M | 9.7% | $1.2M |
| Aug 2023 | $167M | $15.6M | 9.3% | $1.3M |
| Jul 2023 | $145M | $14.1M | 9.8% | $1.2M |
| Jun 2023 | $132M | $12.7M | 9.6% | $1.1M |
| May 2023 | $138M | $13.0M | 9.5% | $1.1M |
| Apr 2023 | $109M | $10.1M | 9.2% | $859K |
| Mar 2023 | $133M | $12.5M | 9.4% | $1.1M |
| Feb 2023 | $109M | $10.2M | 9.4% | $870K |
| Jan 2023 | $112M | $10.9M | 9.7% | $936K |
| Dec 2022 | $90.1M | $8.8M | 9.8% | $749K |
| Nov 2022 | $109M | $10.0M | 9.2% | $858K |
| Oct 2022 | $133M | $12.7M | 9.5% | $1.1M |
| Sep 2022 | $146M | $14.1M | 9.6% | $1.2M |
| Aug 2022 | $166M | $15.7M | 9.5% | $1.3M |
| Jul 2022 | $129M | $12.5M | 9.7% | $1.1M |
| Jun 2022 | $134M | $12.4M | 9.3% | $1.1M |
| May 2022 | $131M | $12.4M | 9.5% | $1.1M |
| Apr 2022 | $101M | $9.8M | 9.7% | $821K |
| Mar 2022 | $129M | $12.4M | 9.6% | $1.1M |
| Feb 2022 | $107M | $10.6M | 9.9% | $905K |
| Jan 2022 | $112M | $10.5M | 9.3% | $892K |
| Dec 2021 | $110M | $10.8M | 9.8% | $909K |
| Nov 2021 | $115M | $10.7M | 9.3% | |
| Oct 2021 | $125M | $12.3M | 9.9% | $1.1M |
| Sep 2021 | $155M | $14.4M | 9.3% | $1.2M |
| Aug 2021 | $142M | $14.0M | 9.8% | $1.2M |
| Jul 2021 | $141M | $13.5M | 9.6% | $1.1M |
| Jun 2021 | $136M | $13.1M | 9.6% | $1.1M |
| May 2021 | $129M | $12.8M | 9.9% | $1.1M |
| Apr 2021 | $117M | $11.3M | 9.7% | $958K |
| Mar 2021 | $139M | $13.5M | 9.7% | $1.1M |
| Feb 2021 | $97.2M | $9.2M | 9.5% | $775K |
| Jan 2021 | $106M | $10.2M | 9.6% | $856K |
| Year | Handle | Revenue (GGR) | State tax |
|---|---|---|---|
| 2026 | $1.17B (8 mo) | $112M (8 mo) | $9.6M (8 mo) |
| 2025 | $1.62B | $157M | $13.5M |
| 2024 | $1.58B | $151M | $13.0M |
| 2023 | $1.54B | $147M | $12.6M |
| 2022 | $1.49B | $142M | $12.1M |
| 2021 | $1.51B | $146M | $11.5M (11 mo) |
Years with missing months show partial totals, marked with the number of months reported.
Notes
GGR is statistical win from slot machines plus table games in Deadwood. Tax paid is the report's "Tax Due" (9% of taxable adjusted gross revenue), which covers slots, table games and sports wagering together.
Sources
Related charts
Same chart for other states
Colorado · Delaware · Florida · Illinois · Indiana · Iowa · Kansas · Louisiana · Maine · Maryland · Massachusetts · Michigan · Mississippi · Missouri · Nebraska · Nevada · New Jersey · New Mexico · New York · Ohio · Pennsylvania · Rhode Island · Virginia · West Virginia