States / South Dakota / Chart
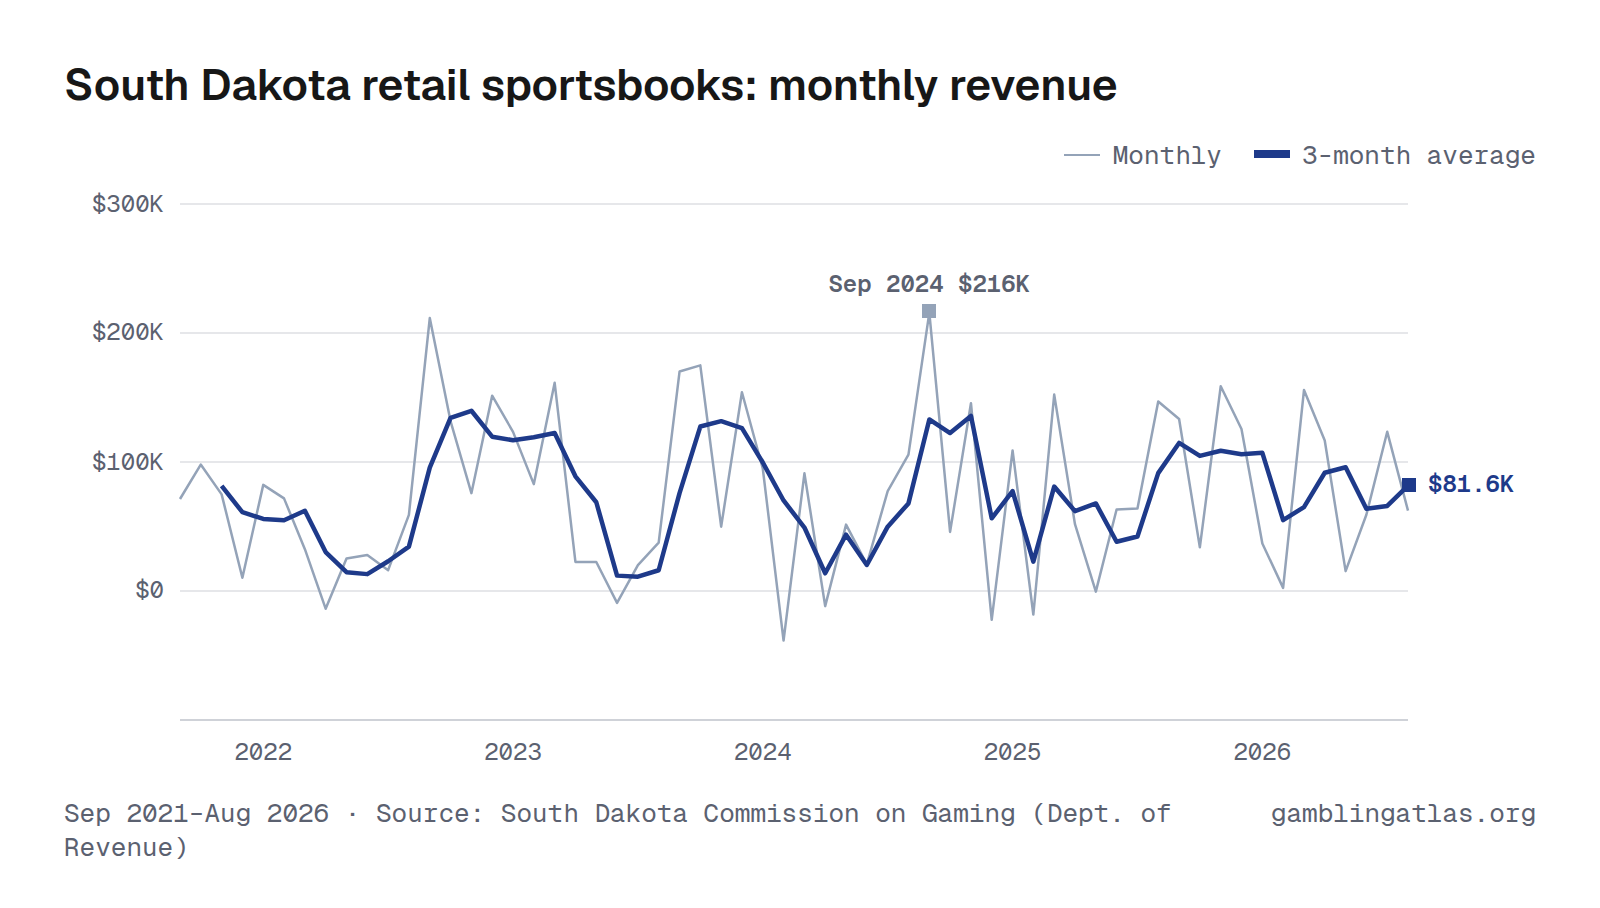
South Dakota Retail Sports Betting Revenue and Handle by Month
South Dakota retail sportsbooks produced $62.3K in gross gaming revenue in August 2026, down 58% from Aug 2025. Over the 12 months through Aug 2026, revenue totaled $1.0M on $10.3M in bets, a 9.9% hold. In the shared comparison window Sep 2025–Aug 2026, it ranked 24th largest of 25 states with monthly retail sports betting revenue.
The highest month on record here is Sep 2024 ($216K). Monthly figures run from Sep 2021 to Aug 2026 and come from the South Dakota Commission on Gaming (Dept. of Revenue).
Sep 2021–Aug 2026 · Source: South Dakota Commission on Gaming (Dept. of Revenue) · South Dakota revenue
Handle (amount bet)
Download, embed or cite
Free to reuse with a link to this page. License and sources
Data
| Month | Handle | Revenue (GGR) | Hold |
|---|---|---|---|
| Aug 2026 | $347K | $62.3K | 18.0% |
| Jul 2026 | $459K | $123K | 26.9% |
| Jun 2026 | $427K | $59.1K | 13.8% |
| May 2026 | $491K | $15.4K | 3.1% |
| Apr 2026 | $597K | $117K | 19.6% |
| Mar 2026 | $1.6M | $156K | 9.6% |
| Feb 2026 | $753K | $2,455 | 0.3% |
| Jan 2026 | $1.1M | $36.9K | 3.4% |
| Dec 2025 | $1.2M | $126K | 10.3% |
| Nov 2025 | $1.2M | $159K | 13.3% |
| Oct 2025 | $1000K | $33.9K | 3.4% |
| Sep 2025 | $1.1M | $133K | 11.9% |
| Aug 2025 | $649K | $147K | 22.7% |
| Jul 2025 | $530K | $64.0K | 12.1% |
| Jun 2025 | $511K | $63.2K | 12.4% |
| May 2025 | $612K | −$478 | -0.1% |
| Apr 2025 | $635K | $51.8K | 8.2% |
| Mar 2025 | $1.6M | $152K | 9.7% |
| Feb 2025 | $734K | −$18.3K | -2.5% |
| Jan 2025 | $1.0M | $109K | 10.6% |
| Dec 2024 | $1.0M | −$22.3K | -2.2% |
| Nov 2024 | $1.0M | $146K | 14.5% |
| Oct 2024 | $916K | $45.8K | 5.0% |
| Sep 2024 | $968K | $216K | 22.3% |
| Aug 2024 | $506K | $106K | 20.9% |
| Jul 2024 | $453K | $77.4K | 17.1% |
| Jun 2024 | $558K | $20.7K | 3.7% |
| May 2024 | $495K | $51.5K | 10.4% |
| Apr 2024 | $504K | −$11.7K | -2.3% |
| Mar 2024 | $1.2M | $91.2K | 7.3% |
| Feb 2024 | $696K | −$38.4K | -5.5% |
| Jan 2024 | $869K | $94.8K | 10.9% |
| Dec 2023 | $1.1M | $154K | 13.5% |
| Nov 2023 | $968K | $49.9K | 5.2% |
| Oct 2023 | $1.0M | $175K | 17.1% |
| Sep 2023 | $980K | $170K | 17.4% |
| Aug 2023 | $518K | $37.5K | 7.2% |
| Jul 2023 | $413K | $20.1K | 4.9% |
| Jun 2023 | $417K | −$9,254 | -2.2% |
| May 2023 | $529K | $22.5K | 4.3% |
| Apr 2023 | $493K | $22.5K | 4.6% |
| Mar 2023 | $924K | $161K | 17.5% |
| Feb 2023 | $717K | $82.9K | 11.6% |
| Jan 2023 | $910K | $123K | 13.6% |
| Dec 2022 | $758K | $151K | 20.0% |
| Nov 2022 | $862K | $75.9K | 8.8% |
| Oct 2022 | $862K | $132K | 15.3% |
| Sep 2022 | $712K | $212K | 29.7% |
| Aug 2022 | $267K | $59.1K | 22.1% |
| Jul 2022 | $259K | $16.1K | 6.2% |
| Jun 2022 | $301K | $27.9K | 9.3% |
| May 2022 | $308K | $25.1K | 8.2% |
| Apr 2022 | $369K | −$13.7K | -3.7% |
| Mar 2022 | $975K | $32.4K | 3.3% |
| Feb 2022 | $686K | $71.8K | 10.5% |
| Jan 2022 | $835K | $82.3K | 9.9% |
| Dec 2021 | $675K | $10.3K | 1.5% |
| Nov 2021 | $718K | $74.9K | 10.4% |
| Oct 2021 | $815K | $98.0K | 12.0% |
| Sep 2021 | $443K | $71.3K | 16.1% |
| Year | Handle | Revenue (GGR) |
|---|---|---|
| 2026 | $5.8M (8 mo) | $572K (8 mo) |
| 2025 | $10.8M | $1.0M |
| 2024 | $9.2M | $776K |
| 2023 | $9.0M | $1.0M |
| 2022 | $7.2M | $872K |
| 2021 | $2.7M (4 mo) | $255K (4 mo) |
Years with missing months show partial totals, marked with the number of months reported.
Notes
GGR is statistical win from in-person sports wagering in Deadwood. Tax is combined with casino games and shown on the casino series.
Sources
Related charts
Same chart for other states
Colorado · Connecticut · Delaware · District of Columbia · Illinois · Indiana · Iowa · Kansas · Kentucky · Louisiana · Maine · Maryland · Massachusetts · Michigan · Mississippi · Nebraska · Nevada · New Hampshire · New Jersey · New York · Ohio · Pennsylvania · Rhode Island · West Virginia