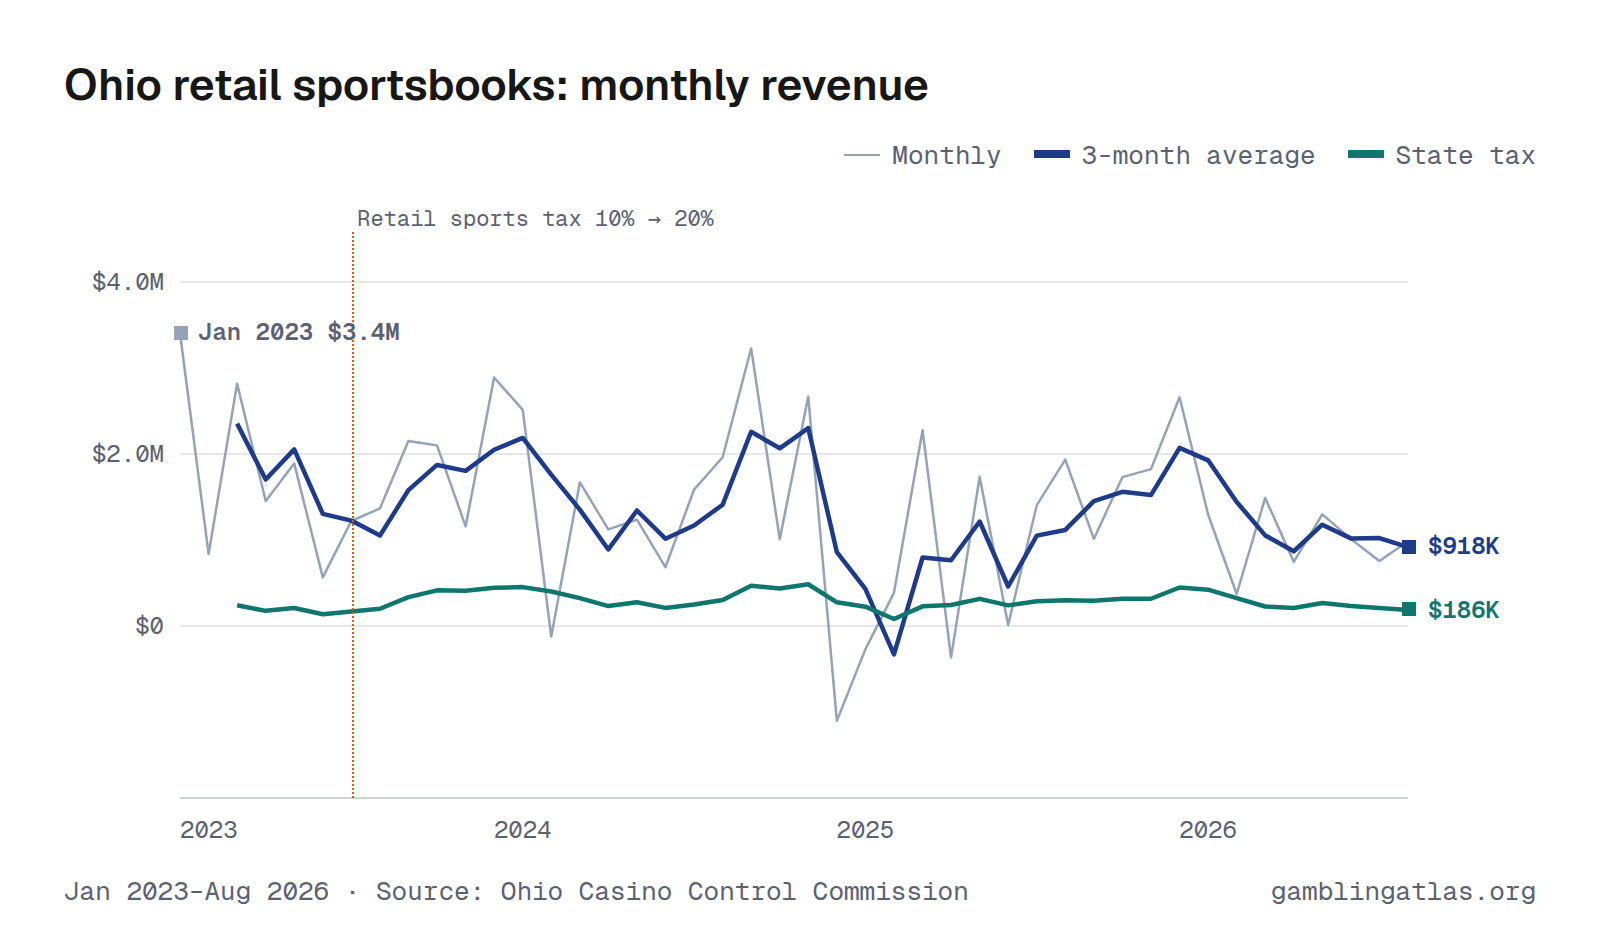
Ohio Retail Sports Betting Revenue and Handle by Month
Ohio retail sportsbooks produced $985K in gross gaming revenue in August 2026, down 49% from Aug 2025. Over the 12 months through Aug 2026, revenue totaled $15.2M on $159M in bets, a 9.6% hold, and the state collected $3.3M in tax. In the shared comparison window Sep 2025–Aug 2026, it ranked 11th largest of 25 states with monthly retail sports betting revenue.
The highest month on record here is Jan 2023 ($3.4M). Monthly figures run from Jan 2023 to Aug 2026 and come from the Ohio Casino Control Commission.
Jan 2023–Aug 2026 · Source: Ohio Casino Control Commission · Ohio revenue
Handle (amount bet)
Download, embed or cite
Free to reuse with a link to this page. License and sources
Data
| Month | Handle | Revenue (GGR) | Hold | State tax |
|---|---|---|---|---|
| Aug 2026 | $8.1M | $985K | 12.1% | $197K |
| Jul 2026 | $7.5M | $756K | 10.0% | $151K |
| Jun 2026 | $7.8M | $1.0M | 12.9% | $209K |
| May 2026 | $11.0M | $1.3M | 11.8% | $270K |
| Apr 2026 | $14.1M | $745K | 5.3% | $221K |
| Mar 2026 | $12.9M | $1.5M | 11.6% | $311K |
| Feb 2026 | $10.3M | $373K | 3.6% | $97.4K |
| Jan 2026 | $13.5M | $1.3M | 9.6% | $271K |
| Dec 2025 | $22.1M | $2.7M | 12.1% | $607K |
| Nov 2025 | $17.3M | $1.8M | 10.5% | $390K |
| Oct 2025 | $17.1M | $1.7M | 10.1% | $346K |
| Sep 2025 | $17.0M | $1.0M | 5.9% | $215K |
| Aug 2025 | $11.6M | $1.9M | 16.6% | $387K |
| Jul 2025 | $10.0M | $1.4M | 14.1% | $282K |
| Jun 2025 | $18.9M | $11.2K | 0.1% | $230K |
| May 2025 | $14.1M | $1.7M | 12.3% | $348K |
| Apr 2025 | $12.5M | −$367K | -2.9% | $140K |
| Mar 2025 | $19.1M | $2.3M | 11.9% | $458K |
| Feb 2025 | $12.5M | $386K | 3.1% | $133K |
| Jan 2025 | $19.0M | −$272K | -1.4% | $93.6K |
| Dec 2024 | $19.2M | −$1.1M | -5.7% | $19.1K |
| Nov 2024 | $20.9M | $2.7M | 12.8% | $563K |
| Oct 2024 | $19.7M | $1.0M | 5.1% | $245K |
| Sep 2024 | $20.7M | $3.2M | 15.6% | $647K |
| Aug 2024 | $13.0M | $2.0M | 15.1% | $414K |
| Jul 2024 | $10.2M | $1.6M | 15.5% | $346K |
| Jun 2024 | $13.7M | $684K | 5.0% | $149K |
| May 2024 | $16.4M | $1.2M | 7.5% | $252K |
| Apr 2024 | $16.1M | $1.1M | 7.0% | $230K |
| Mar 2024 | $23.4M | $1.7M | 7.1% | $343K |
| Feb 2024 | $13.4M | −$122K | -0.9% | $123K |
| Jan 2024 | $18.4M | $2.5M | 13.7% | $505K |
| Dec 2023 | $20.2M | $2.9M | 14.3% | $578K |
| Nov 2023 | $23.1M | $1.2M | 5.0% | $273K |
| Oct 2023 | $22.1M | $2.1M | 9.5% | $485K |
| Sep 2023 | $22.4M | $2.2M | 9.6% | $475K |
| Aug 2023 | $14.5M | $1.4M | 9.5% | $284K |
| Jul 2023 | $11.5M | $1.2M | 10.6% | $247K |
| Jun 2023 | $13.7M | $566K | 4.1% | $68.9K |
| May 2023 | $15.6M | $1.9M | 12.1% | $193K |
| Apr 2023 | $14.9M | $1.5M | 9.7% | $150K |
| Mar 2023 | $21.9M | $2.8M | 12.8% | $285K |
| Feb 2023 | $17.7M | $836K | 4.7% | $94.0K |
| Jan 2023 | $23.0M | $3.4M | 14.8% | $342K |
| Year | Handle | Revenue (GGR) | State tax |
|---|---|---|---|
| 2026 | $85.3M (8 mo) | $8.0M (8 mo) | $1.7M (8 mo) |
| 2025 | $191M | $14.3M | $3.6M |
| 2024 | $205M | $16.5M | $3.8M |
| 2023 | $221M | $21.9M | $3.5M |
Years with missing months show partial totals, marked with the number of months reported.
| Operator | Handle | GGR |
|---|---|---|
| PENN Entertainment | $60.5M | $6.6M |
| JACK Entertainment | $36.8M | $4.2M |
| Hard Rock Digital | $16.9M | $1.6M |
| Caesars Entertainment | $10.7M | $1.0M |
| Betly | $5.4M | $789K |
| BetMGM | $24.5M | $410K |
| Fanatics | $2.2M | $270K |
| FanDuel | $1.8M | $261K |
| Bally's Corporation | $0 | $0 |
License-holder totals may include partner-operated brands.
Notes
GGR is the sports gaming workbook's retail "Revenue" column. Adjusted revenue is the workbook's "Taxable Revenue" for retail operators. Tax paid is an estimate, 10% (20% from July 2023) of the workbook's taxable revenue, since Ohio publishes no monthly tax figure. The Casino Control Commission prints taxable revenue; the Department of Taxation reports sports gaming tax only as fiscal-year totals. Summed over the receipt months each fiscal year's returns cover, the estimate is within 1% of those totals ($159.9M vs $159.5M for FY2024, $180.8M vs $181.8M for FY2025).
Sources
- OCCC 2023 Ohio Sports Gaming Revenue Report
- OCCC 2024 Ohio Sports Gaming Revenue Report
- OCCC 2025 Ohio Sports Gaming Revenue Report
- OCCC 2026 Ohio Sports Gaming Revenue Report
Related charts
Same chart for other states
Colorado · Connecticut · Delaware · District of Columbia · Illinois · Indiana · Iowa · Kansas · Kentucky · Louisiana · Maine · Maryland · Massachusetts · Michigan · Mississippi · Nebraska · Nevada · New Hampshire · New Jersey · New York · Pennsylvania · Rhode Island · South Dakota · West Virginia