Indiana Retail Sports Betting Revenue by Month
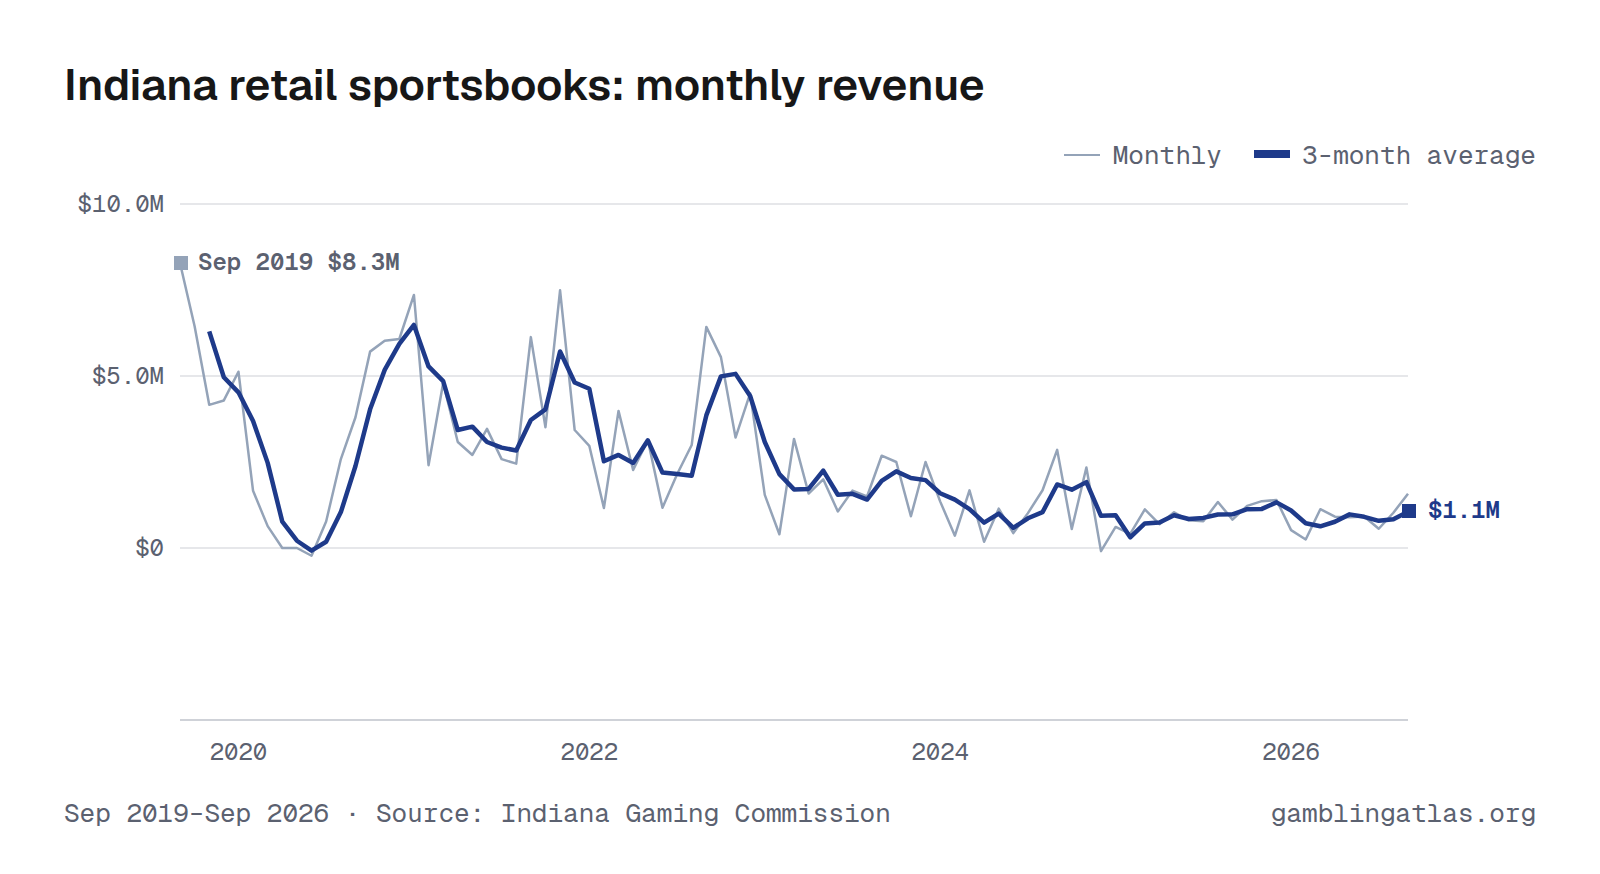
Indiana retail sportsbooks produced $1.6M in gross gaming revenue in September 2026, up 91% from Sep 2025. Over the 12 months through Sep 2026, revenue totaled $11.8M. In the shared comparison window Sep 2025–Aug 2026, it ranked 14th largest of 25 states with monthly retail sports betting revenue.
The highest month on record here is Sep 2019 ($8.3M). Monthly figures run from Sep 2019 to Sep 2026 and come from the Indiana Gaming Commission.
Sep 2019–Sep 2026 · Source: Indiana Gaming Commission · Indiana revenue
Download, embed or cite
Free to reuse with a link to this page. License and sources
Data
| Month | Revenue (GGR) |
|---|---|
| Sep 2026 | $1.6M |
| Aug 2026 | $1.0M |
| Jul 2026 | $559K |
| Jun 2026 | $915K |
| May 2026 | $894K |
| Apr 2026 | $911K |
| Mar 2026 | $1.1M |
| Feb 2026 | $249K |
| Jan 2026 | $519K |
| Dec 2025 | $1.4M |
| Nov 2025 | $1.4M |
| Oct 2025 | $1.2M |
| Sep 2025 | $824K |
| Aug 2025 | $1.3M |
| Jul 2025 | $781K |
| Jun 2025 | $803K |
| May 2025 | $1.0M |
| Apr 2025 | $690K |
| Mar 2025 | $1.1M |
| Feb 2025 | $412K |
| Jan 2025 | $612K |
| Dec 2024 | −$90.7K |
| Nov 2024 | $2.3M |
| Oct 2024 | $551K |
| Sep 2024 | $2.9M |
| Aug 2024 | $1.7M |
| Jul 2024 | $1.0M |
| Jun 2024 | $433K |
| May 2024 | $1.1M |
| Apr 2024 | $180K |
| Mar 2024 | $1.7M |
| Feb 2024 | $360K |
| Jan 2024 | $1.4M |
| Dec 2023 | $2.5M |
| Nov 2023 | $922K |
| Oct 2023 | $2.5M |
| Sep 2023 | $2.7M |
| Aug 2023 | $1.5M |
| Jul 2023 | $1.7M |
| Jun 2023 | $1.1M |
| May 2023 | $2.0M |
| Apr 2023 | $1.6M |
| Mar 2023 | $3.2M |
| Feb 2023 | $399K |
| Jan 2023 | $1.5M |
| Dec 2022 | $4.5M |
| Nov 2022 | $3.2M |
| Oct 2022 | $5.5M |
| Sep 2022 | $6.4M |
| Aug 2022 | $3.0M |
| Jul 2022 | $2.1M |
| Jun 2022 | $1.2M |
| May 2022 | $3.1M |
| Apr 2022 | $2.3M |
| Mar 2022 | $4.0M |
| Feb 2022 | $1.2M |
| Jan 2022 | $3.0M |
| Dec 2021 | $3.4M |
| Nov 2021 | $7.5M |
| Oct 2021 | $3.5M |
| Sep 2021 | $6.1M |
| Aug 2021 | $2.5M |
| Jul 2021 | $2.6M |
| Jun 2021 | $3.5M |
| May 2021 | $2.7M |
| Apr 2021 | $3.1M |
| Mar 2021 | $4.8M |
| Feb 2021 | $2.4M |
| Jan 2021 | $7.4M |
| Dec 2020 | $6.1M |
| Nov 2020 | $6.0M |
| Oct 2020 | $5.7M |
| Sep 2020 | $3.8M |
| Aug 2020 | $2.6M |
| Jul 2020 | $769K |
| Jun 2020 | −$225K |
| May 2020 | −$341 |
| Apr 2020 | −$442 |
| Mar 2020 | $636K |
| Feb 2020 | $1.7M |
| Jan 2020 | $5.1M |
| Dec 2019 | $4.3M |
| Nov 2019 | $4.2M |
| Oct 2019 | $6.4M |
| Sep 2019 | $8.3M |
| Year | Revenue (GGR) |
|---|---|
| 2026 | $7.8M (9 mo) |
| 2025 | $11.6M |
| 2024 | $13.5M |
| 2023 | $21.5M |
| 2022 | $39.5M |
| 2021 | $49.4M |
| 2020 | $32.2M |
| 2019 | $23.2M (4 mo) |
Years with missing months show partial totals, marked with the number of months reported.
| Operator | Handle | GGR |
|---|---|---|
| Caesars Entertainment | $46.7M | $6.5M |
| Bally's Corporation | $19.5M | $1.7M |
| Hard Rock International | $10.9M | $1.4M |
| PENN Entertainment | $12.5M | $1.1M |
| Boyd Gaming | $33.6M | $626K |
| Churchill Downs Incorporated | $2.1M | $224K |
| Blue Sky Casino | $4.3M | $152K |
License-holder totals may include partner-operated brands.
Notes
GGR is retail "Gross Receipts" before adjustments, before promotional credits. Taxable AGR and tax are reported combined with online and shown on the online series.
Sources
- IGC Monthly Revenue Report, 2026-04 (XLSX)
- IGC Monthly Revenue Report, 2026-05 (XLSX)
- IGC Monthly Revenue Report, 2026-06 (XLSX)
- IGC Monthly Revenue Report, 2026-07 (XLSX)
- IGC Monthly Revenue Report, 2026-08 (XLSX)
- IGC Monthly Revenue Report, 2026-09 (XLSX)
Related charts
Same chart for other states
Colorado · Connecticut · Delaware · District of Columbia · Illinois · Iowa · Kansas · Kentucky · Louisiana · Maine · Maryland · Massachusetts · Michigan · Mississippi · Nebraska · Nevada · New Hampshire · New Jersey · New York · Ohio · Pennsylvania · Rhode Island · South Dakota · West Virginia