Indiana Gambling Tax Revenue by Month
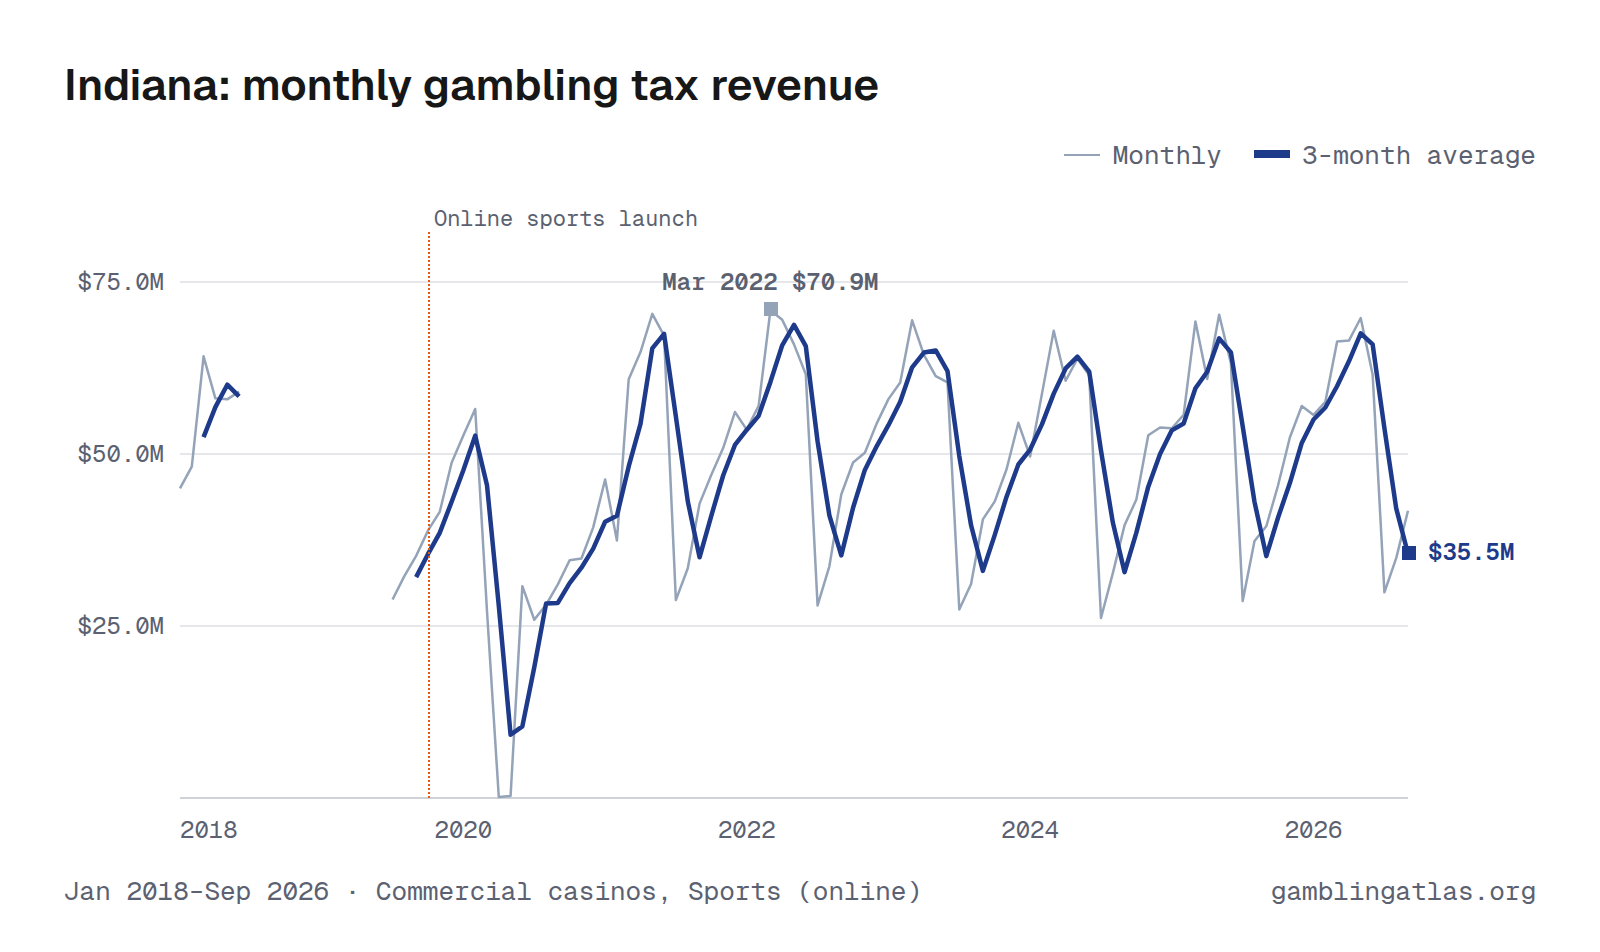
Indiana collected $41.8M in gambling taxes in September 2026, up 6% from Sep 2025. Over the 12 months through Sep 2026, tax collections totaled $639M. That is the 10th largest total of the 33 states with monthly tax figures in the atlas.
The total covers casinos and online sportsbooks, as reported each month from Jan 2018. Months after one product's latest report are left off so a reporting lag doesn't read as a drop.
Jan 2018–Sep 2026 · Commercial casinos, Sports (online) · Indiana revenue
Download, embed or cite
Free to reuse with a link to this page. License and sources
Data
| Month | Total | Commercial casinos | Sports (online) |
|---|---|---|---|
| Sep 2026 | $41.8M | $37.1M | $4.7M |
| Aug 2026 | $34.9M | $31.4M | $3.5M |
| Jul 2026 | $29.9M | $26.1M | $3.8M |
| Jun 2026 | $61.6M | $58.1M | $3.5M |
| May 2026 | $69.8M | $65.0M | $4.8M |
| Apr 2026 | $66.5M | $61.8M | $4.7M |
| Mar 2026 | $66.4M | $61.7M | $4.7M |
| Feb 2026 | $57.6M | $53.6M | $3.9M |
| Jan 2026 | $55.7M | $51.0M | $4.7M |
| Dec 2025 | $57.0M | $50.8M | $6.2M |
| Nov 2025 | $52.4M | $45.8M | $6.6M |
| Oct 2025 | $45.5M | $41.3M | $4.2M |
| Sep 2025 | $39.5M | $35.4M | $4.1M |
| Aug 2025 | $37.4M | $33.0M | $4.3M |
| Jul 2025 | $28.6M | $25.3M | $3.3M |
| Jun 2025 | $63.1M | $58.8M | $4.3M |
| May 2025 | $70.3M | $66.1M | $4.2M |
| Apr 2025 | $60.9M | $57.1M | $3.8M |
| Mar 2025 | $69.3M | $65.9M | $3.4M |
| Feb 2025 | $55.7M | $51.1M | $4.5M |
| Jan 2025 | $53.7M | $48.5M | $5.2M |
| Dec 2024 | $53.9M | $50.9M | $3.0M |
| Nov 2024 | $52.7M | $46.2M | $6.5M |
| Oct 2024 | $43.4M | $40.0M | $3.3M |
| Sep 2024 | $39.7M | $34.6M | $5.0M |
| Aug 2024 | $32.6M | $29.6M | $3.0M |
| Jul 2024 | $26.2M | $23.4M | $2.8M |
| Jun 2024 | $61.4M | $58.5M | $2.9M |
| May 2024 | $63.9M | $60.2M | $3.7M |
| Apr 2024 | $60.6M | $57.1M | $3.5M |
| Mar 2024 | $67.9M | $64.2M | $3.7M |
| Feb 2024 | $58.7M | $55.1M | $3.6M |
| Jan 2024 | $49.6M | $44.6M | $5.1M |
| Dec 2023 | $54.5M | $49.7M | $4.8M |
| Nov 2023 | $47.8M | $44.9M | $2.9M |
| Oct 2023 | $43.1M | $38.8M | $4.3M |
| Sep 2023 | $40.5M | $36.5M | $4.0M |
| Aug 2023 | $31.1M | $28.9M | $2.2M |
| Jul 2023 | $27.4M | $25.2M | $2.2M |
| Jun 2023 | $60.4M | $58.5M | $1.8M |
| May 2023 | $61.3M | $58.1M | $3.2M |
| Apr 2023 | $64.4M | $61.6M | $2.8M |
| Mar 2023 | $69.4M | $65.4M | $4.1M |
| Feb 2023 | $60.4M | $57.6M | $2.8M |
| Jan 2023 | $58.0M | $54.5M | $3.5M |
| Dec 2022 | $54.4M | $50.4M | $4.1M |
| Nov 2022 | $50.2M | $46.4M | $3.8M |
| Oct 2022 | $48.8M | $44.3M | $4.5M |
| Sep 2022 | $44.1M | $39.3M | $4.9M |
| Aug 2022 | $33.7M | $31.3M | $2.4M |
| Jul 2022 | $28.0M | $26.0M | $2.0M |
| Jun 2022 | $61.6M | $60.1M | $1.5M |
| May 2022 | $65.9M | $63.0M | $2.9M |
| Apr 2022 | $69.5M | $66.8M | $2.7M |
| Mar 2022 | $70.9M | $67.8M | $3.1M |
| Feb 2022 | $57.0M | $55.4M | $1.6M |
| Jan 2022 | $53.5M | $50.2M | $3.4M |
| Dec 2021 | $56.1M | $53.6M | $2.4M |
| Nov 2021 | $50.9M | $46.3M | $4.5M |
| Oct 2021 | $47.0M | $44.4M | $2.6M |
| Sep 2021 | $42.8M | $39.6M | $3.2M |
| Aug 2021 | $33.4M | $31.8M | $1.6M |
| Jul 2021 | $28.8M | $27.1M | $1.7M |
| Jun 2021 | $67.2M | $64.8M | $2.4M |
| May 2021 | $70.4M | $68.6M | $1.8M |
| Apr 2021 | $64.8M | $62.9M | $1.9M |
| Mar 2021 | $60.9M | $58.4M | $2.5M |
| Feb 2021 | $37.4M | $35.8M | $1.6M |
| Jan 2021 | $46.3M | $43.5M | $2.8M |
| Dec 2020 | $39.3M | $37.0M | $2.3M |
| Nov 2020 | $34.8M | $32.4M | $2.4M |
| Oct 2020 | $34.6M | $32.6M | $2.0M |
| Sep 2020 | $31.0M | $29.7M | $1.4M |
| Aug 2020 | $28.1M | $27.2M | $934K |
| Jul 2020 | $25.9M | $25.3M | $633K |
| Jun 2020 | $30.8M | $30.5M | $278K |
| May 2020 | $302K | $0 | $302K |
| Apr 2020 | $148K | $0 | $148K |
| Mar 2020 | $27.1M | $26.6M | $522K |
| Feb 2020 | $56.5M | $55.5M | $1.1M |
| Jan 2020 | $52.7M | $51.5M | $1.2M |
| Dec 2019 | $48.7M | $47.6M | $1.1M |
| Nov 2019 | $41.6M | $40.7M | $883K |
| Oct 2019 | $38.9M | $37.8M | $1.1M |
| Sep 2019 | $35.2M | $34.4M | $813K |
| Aug 2019 | $32.3M | $32.3M | |
| Jul 2019 | $28.9M | $28.9M | |
| Jun 2018 | $59.1M | $59.1M | |
| May 2018 | $57.9M | $57.9M | |
| Apr 2018 | $58.1M | $58.1M | |
| Mar 2018 | $64.2M | $64.2M | |
| Feb 2018 | $48.2M | $48.2M | |
| Jan 2018 | $45.0M | $45.0M |
Notes
Commercial casinos: tax paid is the wagering tax only, excluding the supplemental and admission taxes.
Sports (online): tax paid is the 9.5% sports wagering tax, retail and online combined.
Sources
- IGC Monthly Revenue Report, 2025-12 (XLSX)
- IGC Monthly Revenue Report, 2026-01 (XLSX)
- IGC Monthly Revenue Report, 2026-02 (XLSX)
- IGC Monthly Revenue Report, 2026-03 (XLSX)
- IGC Monthly Revenue Report, 2026-04 (XLSX)
- IGC Monthly Revenue Report, 2026-05 (XLSX)
- IGC Monthly Revenue Report, 2026-06 (XLSX)
- IGC Monthly Revenue Report, 2026-07 (XLSX)
- IGC Monthly Revenue Report, 2026-08 (XLSX)
- IGC Monthly Revenue Report, 2026-09 (XLSX)
Related charts
Same chart for other states
Arizona · Arkansas · Colorado · Connecticut · Delaware · District of Columbia · Florida · Illinois · Iowa · Kansas · Kentucky · Louisiana · Maine · Maryland · Massachusetts · Michigan · Mississippi · Missouri · Nebraska · Nevada · New Hampshire · New Jersey · New Mexico · New York · North Carolina · Ohio · Pennsylvania · South Dakota · Tennessee · Vermont · Virginia · West Virginia · Wyoming