States / Pennsylvania / Chart
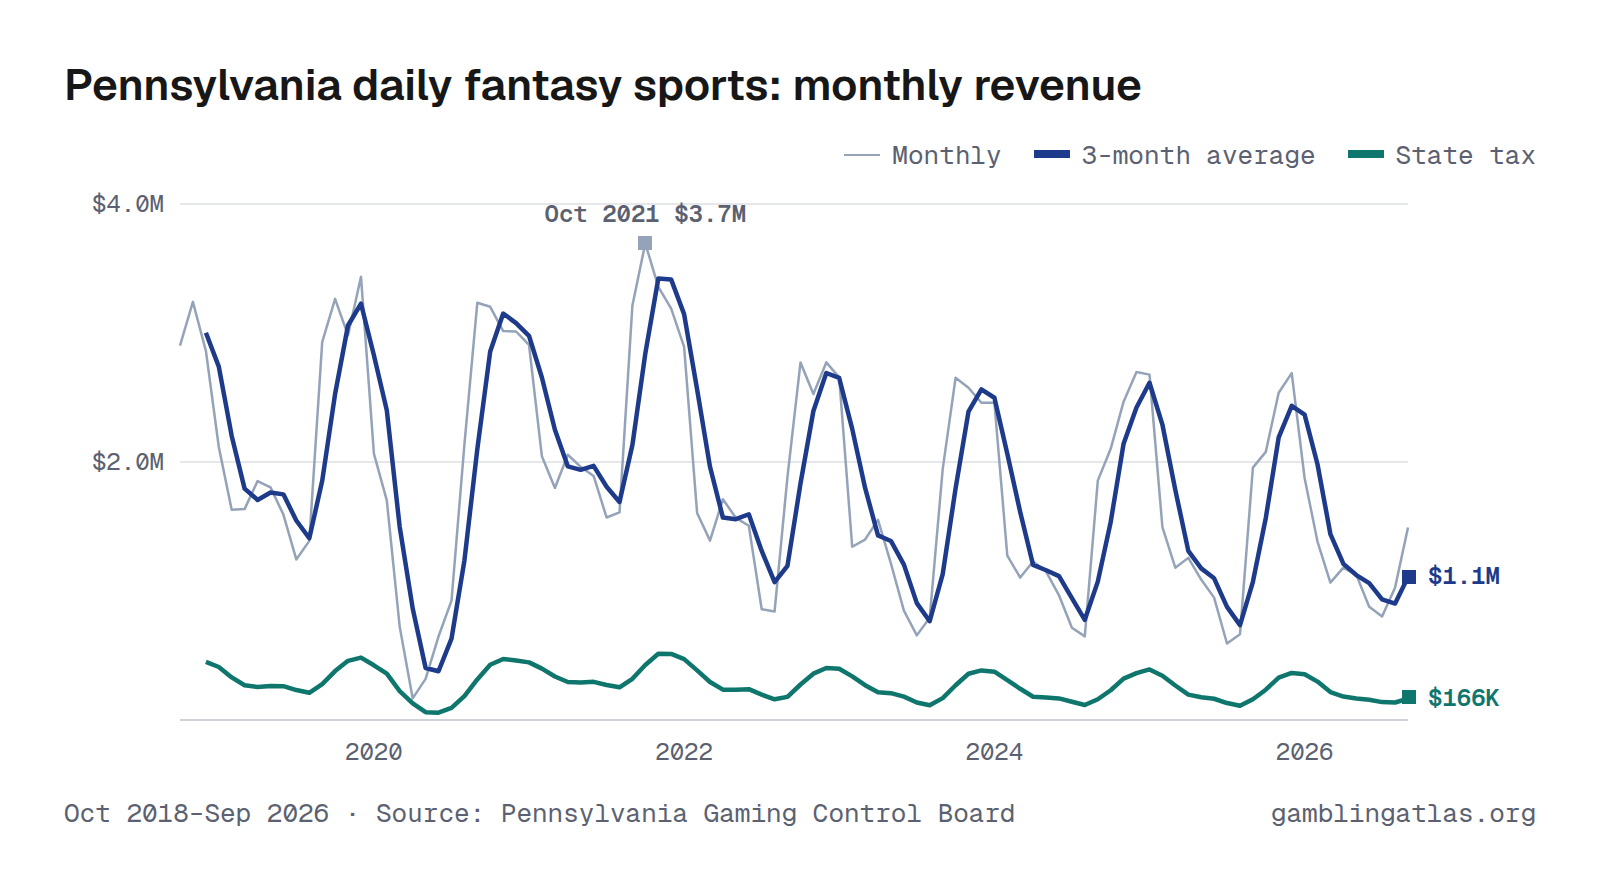
Pennsylvania Daily Fantasy Sports Revenue and Handle by Month
Pennsylvania daily fantasy sports produced $1.5M in gross gaming revenue in September 2026, down 24% from Sep 2025. Over the 12 months through Sep 2026, revenue totaled $18.1M on $153M in bets, a 11.9% hold, and the state collected $2.7M in tax. In the shared comparison window Aug 2025–Jul 2026, it ranked 3rd largest of 8 states with monthly daily fantasy sports revenue.
The highest month on record here is Oct 2021 ($3.7M). Monthly figures run from Oct 2018 to Sep 2026 and come from the Pennsylvania Gaming Control Board.
Oct 2018–Sep 2026 · Source: Pennsylvania Gaming Control Board · Pennsylvania revenue
Handle (amount bet)
Download, embed or cite
Free to reuse with a link to this page. License and sources
Data
| Month | Handle | Revenue (GGR) | Hold | State tax |
|---|---|---|---|---|
| Sep 2026 | $13.8M | $1.5M | 10.8% | $224K |
| Aug 2026 | $8.8M | $1.0M | 11.6% | $154K |
| Jul 2026 | $6.8M | $803K | 11.9% | $120K |
| Jun 2026 | $7.5M | $877K | 11.7% | $132K |
| May 2026 | $8.9M | $1.1M | 12.6% | $164K |
| Apr 2026 | $10.0M | $1.2M | 11.8% | $177K |
| Mar 2026 | $9.3M | $1.1M | 11.5% | $160K |
| Feb 2026 | $9.8M | $1.4M | 14.1% | $207K |
| Jan 2026 | $15.2M | $1.9M | 12.4% | $281K |
| Dec 2025 | $24.3M | $2.7M | 11.1% | $403K |
| Nov 2025 | $19.9M | $2.5M | 12.8% | $381K |
| Oct 2025 | $18.7M | $2.1M | 11.1% | $312K |
| Sep 2025 | $17.3M | $2.0M | 11.3% | $293K |
| Aug 2025 | $5.7M | $665K | 11.7% | $99.7K |
| Jul 2025 | $4.9M | $593K | 12.0% | $88.9K |
| Jun 2025 | $7.8M | $949K | 12.1% | $142K |
| May 2025 | $8.3M | $1.1M | 13.1% | $163K |
| Apr 2025 | $10.3M | $1.3M | 12.2% | $189K |
| Mar 2025 | $9.9M | $1.2M | 12.0% | $177K |
| Feb 2025 | $10.4M | $1.5M | 14.4% | $224K |
| Jan 2025 | $20.0M | $2.7M | 13.4% | $402K |
| Dec 2024 | $22.3M | $2.7M | 12.1% | $405K |
| Nov 2024 | $20.0M | $2.5M | 12.3% | $370K |
| Oct 2024 | $18.8M | $2.1M | 11.2% | $315K |
| Sep 2024 | $16.9M | $1.9M | 11.0% | $278K |
| Aug 2024 | $6.2M | $648K | 10.4% | $97.2K |
| Jul 2024 | $6.6M | $715K | 10.8% | $107K |
| Jun 2024 | $9.1M | $967K | 10.7% | $145K |
| May 2024 | $10.3M | $1.2M | 11.1% | $173K |
| Apr 2024 | $11.8M | $1.2M | 10.4% | $184K |
| Mar 2024 | $10.9M | $1.1M | 10.1% | $166K |
| Feb 2024 | $10.6M | $1.3M | 12.0% | $191K |
| Jan 2024 | $21.6M | $2.5M | 11.4% | $369K |
| Dec 2023 | $24.1M | $2.5M | 10.2% | $369K |
| Nov 2023 | $23.5M | $2.6M | 11.0% | $386K |
| Oct 2023 | $24.1M | $2.7M | 11.0% | $398K |
| Sep 2023 | $17.1M | $1.9M | 11.4% | $292K |
| Aug 2023 | $7.9M | $792K | 10.1% | $119K |
| Jul 2023 | $6.6M | $656K | 9.9% | $98.4K |
| Jun 2023 | $8.1M | $849K | 10.5% | $127K |
| May 2023 | $11.4M | $1.2M | 10.6% | $182K |
| Apr 2023 | $14.9M | $1.6M | 10.4% | $233K |
| Mar 2023 | $13.2M | $1.4M | 10.6% | $210K |
| Feb 2023 | $11.3M | $1.3M | 11.9% | $201K |
| Jan 2023 | $25.5M | $2.7M | 10.4% | $398K |
| Dec 2022 | $28.6M | $2.8M | 9.7% | $416K |
| Nov 2022 | $22.8M | $2.5M | 11.1% | $379K |
| Oct 2022 | $26.0M | $2.8M | 10.7% | $416K |
| Sep 2022 | $17.5M | $1.9M | 10.8% | $283K |
| Aug 2022 | $9.4M | $841K | 9.0% | $126K |
| Jul 2022 | $8.5M | $859K | 10.0% | $129K |
| Jun 2022 | $16.2M | $1.5M | 9.3% | $226K |
| May 2022 | $15.2M | $1.6M | 10.3% | $235K |
| Apr 2022 | $16.4M | $1.7M | 10.4% | $257K |
| Mar 2022 | $13.4M | $1.4M | 10.4% | $209K |
| Feb 2022 | $13.5M | $1.6M | 11.9% | $241K |
| Jan 2022 | $27.8M | $2.9M | 10.4% | $434K |
| Dec 2021 | $30.5M | $3.2M | 10.5% | $478K |
| Nov 2021 | $30.8M | $3.4M | 10.9% | $504K |
| Oct 2021 | $33.3M | $3.7M | 11.1% | $554K |
| Sep 2021 | $29.2M | $3.2M | 11.0% | $482K |
| Aug 2021 | $17.4M | $1.6M | 9.3% | $241K |
| Jul 2021 | $15.1M | $1.6M | 10.4% | $236K |
| Jun 2021 | $17.6M | $1.9M | 10.8% | $284K |
| May 2021 | $18.9M | $2.0M | 10.4% | $294K |
| Apr 2021 | $19.8M | $2.1M | 10.4% | $308K |
| Mar 2021 | $17.5M | $1.8M | 10.3% | $270K |
| Feb 2021 | $18.3M | $2.0M | 11.2% | $307K |
| Jan 2021 | $27.5M | $2.9M | 10.6% | $436K |
| Dec 2020 | $28.9M | $3.0M | 10.4% | $452K |
| Nov 2020 | $27.0M | $3.0M | 11.2% | $452K |
| Oct 2020 | $28.7M | $3.2M | 11.2% | $480K |
| Sep 2020 | $27.8M | $3.2M | 11.6% | $485K |
| Aug 2020 | $21.8M | $2.1M | 9.8% | $320K |
| Jul 2020 | $12.1M | $926K | 7.7% | $139K |
| Jun 2020 | $6.8M | $647K | 9.6% | $97.1K |
| May 2020 | $3.4M | $319K | 9.3% | $47.8K |
| Apr 2020 | $1.8M | $167K | 9.4% | $25.1K |
| Mar 2020 | $6.6M | $724K | 10.9% | $109K |
| Feb 2020 | $15.2M | $1.7M | 11.2% | $255K |
| Jan 2020 | $26.4M | $2.1M | 7.8% | $310K |
| Dec 2019 | $29.9M | $3.4M | 11.5% | $515K |
| Nov 2019 | $26.7M | $3.0M | 11.2% | $447K |
| Oct 2019 | $30.2M | $3.3M | 10.8% | $490K |
| Sep 2019 | $28.7M | $2.9M | 10.2% | $439K |
| Aug 2019 | $14.6M | $1.4M | 9.5% | $208K |
| Jul 2019 | $12.6M | $1.2M | 9.9% | $187K |
| Jun 2019 | $15.3M | $1.6M | 10.4% | $239K |
| May 2019 | $16.4M | $1.8M | 11.0% | $270K |
| Apr 2019 | $17.0M | $1.9M | 10.9% | $278K |
| Mar 2019 | $14.9M | $1.6M | 11.0% | $245K |
| Feb 2019 | $14.0M | $1.6M | 11.6% | $244K |
| Jan 2019 | $19.2M | $2.1M | 11.0% | $317K |
| Dec 2018 | $28.7M | $2.9M | 10.0% | $429K |
| Nov 2018 | $28.1M | $3.2M | 11.5% | $486K |
| Oct 2018 | $27.3M | $2.9M | 10.6% | $435K |
| Year | Handle | Revenue (GGR) | State tax |
|---|---|---|---|
| 2026 | $90.1M (9 mo) | $10.8M (9 mo) | $1.6M (9 mo) |
| 2025 | $157M | $19.2M | $2.9M |
| 2024 | $165M | $18.7M | $2.8M |
| 2023 | $188M | $20.1M | $3.0M |
| 2022 | $215M | $22.3M | $3.3M |
| 2021 | $276M | $29.3M | $4.4M |
| 2020 | $206M | $21.1M | $3.2M |
| 2019 | $239M | $25.9M | $3.9M |
| 2018 | $84.1M (3 mo) | $9.0M (3 mo) | $1.4M (3 mo) |
Years with missing months show partial totals, marked with the number of months reported.
| Operator | Handle | GGR |
|---|---|---|
| DraftKings | $109M | $12.7M |
| FanDuel | $30.7M | $3.1M |
| Underdog Fantasy | $6.8M | $1.6M |
| JDAD | $1.3M | $316K |
| Yahoo Fantasy Sports | $3.5M | $217K |
| SportsHub Technologies | $715K | $102K |
| Fantasy Sports Games | $611K | $72.5K |
| DataForce | $217K | $40.8K |
| FastDraft | $19.9K | $1,341 |
| OwnersBox | $45.0K | $870 |
License-holder totals may include partner-operated brands.
Notes
GGR is the report's "Fantasy Contest Adjusted Revenue" line. Tax paid is state tax on fantasy contests (15%).
Sources
Related charts
Same chart for other states
Arizona · Connecticut · Iowa · Louisiana · Maine · Massachusetts · Michigan