States / Pennsylvania / Chart
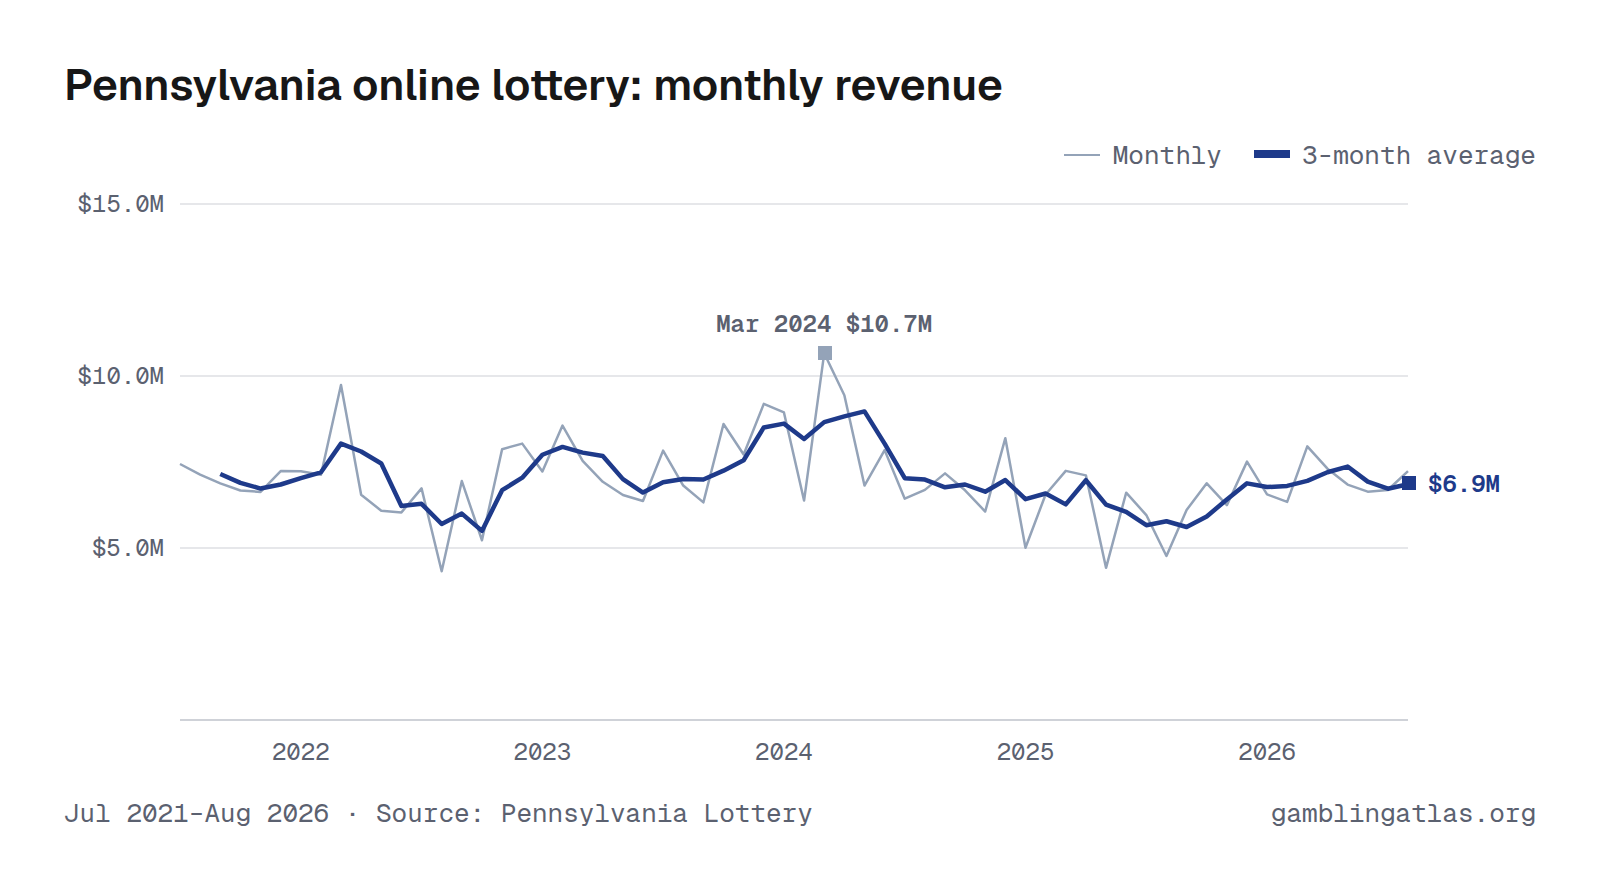
Pennsylvania Online Lottery Revenue and Handle by Month
Pennsylvania online lottery produced $7.2M in gross gaming revenue in August 2026, up 52% from Aug 2025. Over the 12 months through Aug 2026, revenue totaled $82.3M on $847M in bets, a 9.7% hold.
The highest month on record here is Mar 2024 ($10.7M). Monthly figures run from Jul 2021 to Aug 2026 and come from the Pennsylvania Lottery.
Jul 2021–Aug 2026 · Source: Pennsylvania Lottery · Pennsylvania revenue
Handle (amount bet)
Download, embed or cite
Free to reuse with a link to this page. License and sources
Data
| Month | Handle | Revenue (GGR) | Hold |
|---|---|---|---|
| Aug 2026 | $65.8M | $7.2M | 11.0% |
| Jul 2026 | $67.8M | $6.7M | 9.9% |
| Jun 2026 | $67.1M | $6.6M | 9.9% |
| May 2026 | $71.5M | $6.8M | 9.6% |
| Apr 2026 | $70.0M | $7.3M | 10.4% |
| Mar 2026 | $73.1M | $8.0M | 10.9% |
| Feb 2026 | $66.5M | $6.3M | 9.5% |
| Jan 2026 | $75.4M | $6.6M | 8.7% |
| Dec 2025 | $81.0M | $7.5M | 9.3% |
| Nov 2025 | $71.6M | $6.2M | 8.7% |
| Oct 2025 | $68.8M | $6.9M | 10.0% |
| Sep 2025 | $68.3M | $6.1M | 8.9% |
| Aug 2025 | $70.4M | $4.8M | 6.8% |
| Jul 2025 | $65.5M | $6.0M | 9.1% |
| Jun 2025 | $61.6M | $6.6M | 10.7% |
| May 2025 | $67.0M | $4.4M | 6.6% |
| Apr 2025 | $65.6M | $7.1M | 10.8% |
| Mar 2025 | $70.2M | $7.2M | 10.3% |
| Feb 2025 | $64.7M | $6.6M | 10.1% |
| Jan 2025 | $73.2M | $5.0M | 6.8% |
| Dec 2024 | $74.0M | $8.2M | 11.1% |
| Nov 2024 | $68.3M | $6.1M | 8.9% |
| Oct 2024 | $70.7M | $6.7M | 9.4% |
| Sep 2024 | $71.6M | $7.2M | 10.0% |
| Aug 2024 | $72.8M | $6.7M | 9.2% |
| Jul 2024 | $71.3M | $6.4M | 9.0% |
| Jun 2024 | $72.3M | $7.8M | 10.9% |
| May 2024 | $77.0M | $6.8M | 8.9% |
| Apr 2024 | $84.0M | $9.4M | 11.2% |
| Mar 2024 | $93.8M | $10.7M | 11.4% |
| Feb 2024 | $76.3M | $6.4M | 8.4% |
| Jan 2024 | $87.3M | $8.9M | 10.2% |
| Dec 2023 | $89.1M | $9.2M | 10.3% |
| Nov 2023 | $81.2M | $7.7M | 9.5% |
| Oct 2023 | $87.8M | $8.6M | 9.8% |
| Sep 2023 | $74.5M | $6.3M | 8.5% |
| Aug 2023 | $77.7M | $6.8M | 8.8% |
| Jul 2023 | $74.9M | $7.8M | 10.5% |
| Jun 2023 | $65.0M | $6.4M | 9.8% |
| May 2023 | $69.7M | $6.5M | 9.4% |
| Apr 2023 | $73.1M | $6.9M | 9.5% |
| Mar 2023 | $79.3M | $7.5M | 9.5% |
| Feb 2023 | $72.6M | $8.6M | 11.8% |
| Jan 2023 | $82.4M | $7.2M | 8.8% |
| Dec 2022 | $81.9M | $8.0M | 9.8% |
| Nov 2022 | $80.9M | $7.9M | 9.7% |
| Oct 2022 | $71.5M | $5.2M | 7.3% |
| Sep 2022 | $64.8M | $6.9M | 10.7% |
| Aug 2022 | $65.0M | $4.3M | 6.7% |
| Jul 2022 | $66.3M | $6.7M | 10.2% |
| Jun 2022 | $52.7M | $6.0M | 11.4% |
| May 2022 | $56.4M | $6.1M | 10.8% |
| Apr 2022 | $60.4M | $6.5M | 10.8% |
| Mar 2022 | $69.1M | $9.7M | 14.1% |
| Feb 2022 | $59.6M | $7.1M | 12.0% |
| Jan 2022 | $69.3M | $7.2M | 10.4% |
| Dec 2021 | $66.0M | $7.2M | 11.0% |
| Nov 2021 | $59.2M | $6.6M | 11.2% |
| Oct 2021 | $62.3M | $6.7M | 10.7% |
| Sep 2021 | $60.6M | $6.9M | 11.4% |
| Aug 2021 | $66.6M | $7.1M | 10.7% |
| Jul 2021 | $64.2M | $7.4M | 11.6% |
| Year | Handle | Revenue (GGR) |
|---|---|---|
| 2026 | $557M (8 mo) | $55.6M (8 mo) |
| 2025 | $828M | $74.4M |
| 2024 | $919M | $91.3M |
| 2023 | $927M | $89.6M |
| 2022 | $798M | $81.9M |
| 2021 | $379M (6 mo) | $42.0M (6 mo) |
Years with missing months show partial totals, marked with the number of months reported.
Notes
GGR is the PA Lottery's monthly "Comparative Statement of Income and Expenditures," iLottery page, "GROSS GAMING REVENUE" line (e-instant games; "PLAYS" is used as handle). The same report page separately breaks out traditional draw-game tickets bought through the iLottery site ("TRADITIONAL GAME SALES"), which is excluded here rather than conflated with e-instant GGR. The PA Lottery's site only keeps these monthly reports back to 2021-07; iLottery itself launched 2018-05-01, and no older report or archive page was found.