States / Pennsylvania / Chart
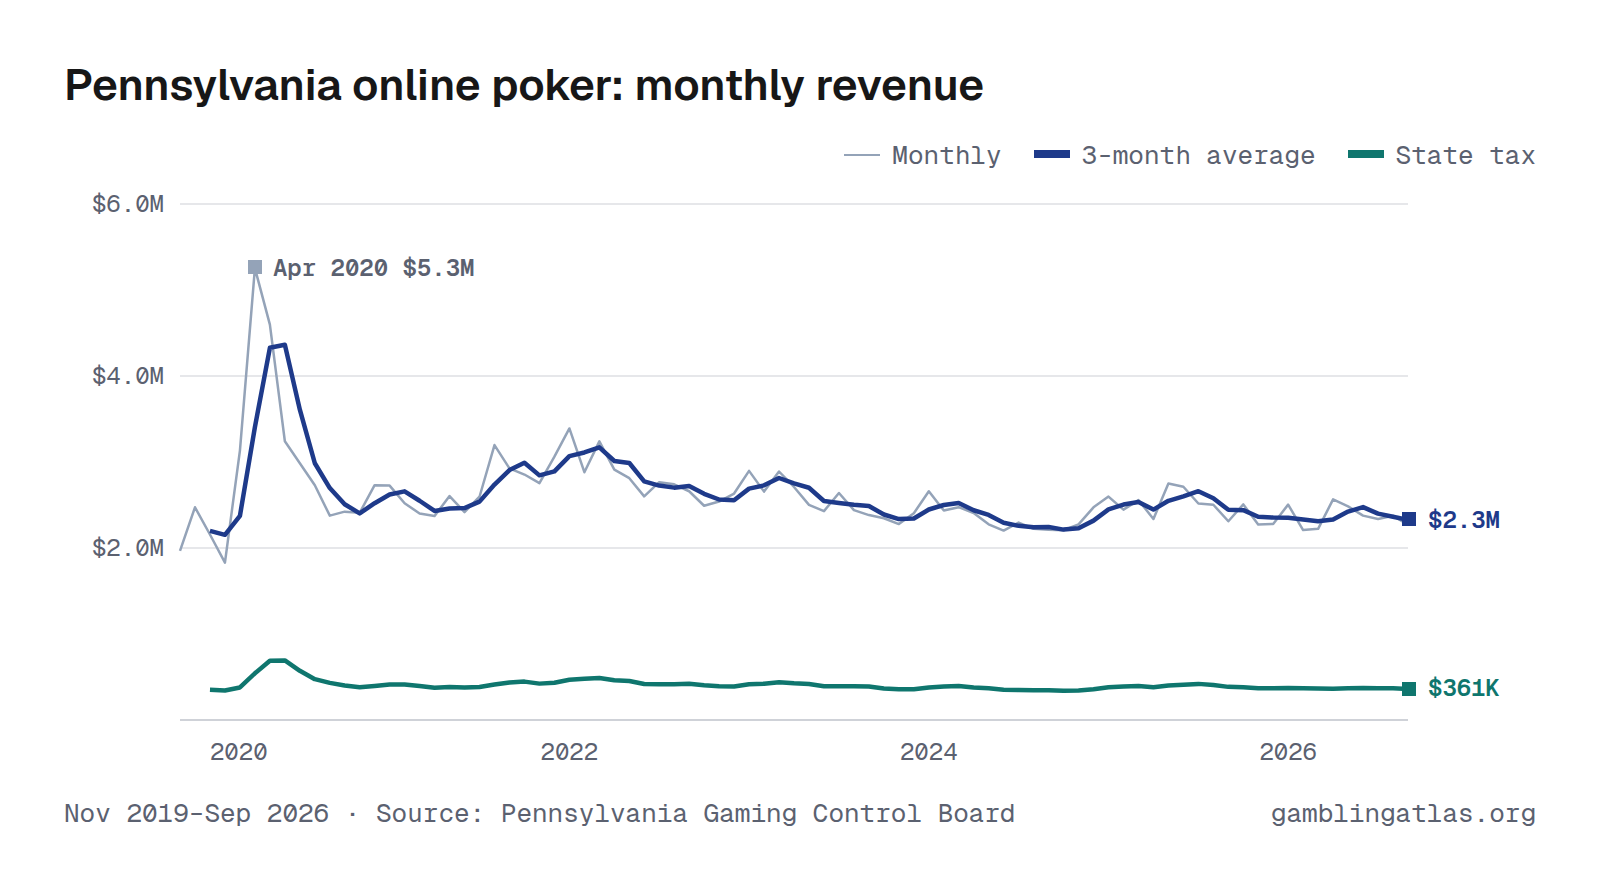
Pennsylvania Online Poker Revenue by Month
Pennsylvania online poker produced $2.3M in gross gaming revenue in September 2026, down 2% from Sep 2025. Over the 12 months through Sep 2026, revenue totaled $28.4M, and the state collected $4.4M in tax. In the shared comparison window Oct 2025–Sep 2026, it ranked 2nd largest of 3 states with monthly online poker revenue.
The highest month on record here is Apr 2020 ($5.3M). Monthly figures run from Nov 2019 to Sep 2026 and come from the Pennsylvania Gaming Control Board.
Nov 2019–Sep 2026 · Source: Pennsylvania Gaming Control Board · Pennsylvania revenue
Download, embed or cite
Free to reuse with a link to this page. License and sources
Data
| Month | Revenue (GGR) | State tax |
|---|---|---|
| Sep 2026 | $2.3M | $339K |
| Aug 2026 | $2.4M | $376K |
| Jul 2026 | $2.3M | $369K |
| Jun 2026 | $2.4M | $362K |
| May 2026 | $2.5M | $373K |
| Apr 2026 | $2.6M | $383K |
| Mar 2026 | $2.2M | $353K |
| Feb 2026 | $2.2M | $351K |
| Jan 2026 | $2.5M | $397K |
| Dec 2025 | $2.3M | $361K |
| Nov 2025 | $2.3M | $356K |
| Oct 2025 | $2.5M | $390K |
| Sep 2025 | $2.3M | $362K |
| Aug 2025 | $2.5M | $394K |
| Jul 2025 | $2.5M | $399K |
| Jun 2025 | $2.7M | $425K |
| May 2025 | $2.8M | $436K |
| Apr 2025 | $2.3M | $365K |
| Mar 2025 | $2.6M | $400K |
| Feb 2025 | $2.4M | $379K |
| Jan 2025 | $2.6M | $407K |
| Dec 2024 | $2.5M | $382K |
| Nov 2024 | $2.3M | $352K |
| Oct 2024 | $2.2M | $339K |
| Sep 2024 | $2.2M | $337K |
| Aug 2024 | $2.2M | $345K |
| Jul 2024 | $2.3M | $357K |
| Jun 2024 | $2.2M | $338K |
| May 2024 | $2.3M | $351K |
| Apr 2024 | $2.4M | $369K |
| Mar 2024 | $2.5M | $387K |
| Feb 2024 | $2.4M | $381K |
| Jan 2024 | $2.7M | $416K |
| Dec 2023 | $2.4M | $370K |
| Nov 2023 | $2.3M | $350K |
| Oct 2023 | $2.3M | $351K |
| Sep 2023 | $2.4M | $369K |
| Aug 2023 | $2.4M | $381K |
| Jul 2023 | $2.6M | $417K |
| Jun 2023 | $2.4M | $377K |
| May 2023 | $2.5M | $384K |
| Apr 2023 | $2.7M | $416K |
| Mar 2023 | $2.9M | $452K |
| Feb 2023 | $2.7M | $411K |
| Jan 2023 | $2.9M | $452K |
| Dec 2022 | $2.6M | $404K |
| Nov 2022 | $2.5M | $388K |
| Oct 2022 | $2.5M | $380K |
| Sep 2022 | $2.7M | $409K |
| Aug 2022 | $2.7M | $425K |
| Jul 2022 | $2.8M | $433K |
| Jun 2022 | $2.6M | $393K |
| May 2022 | $2.8M | $419K |
| Apr 2022 | $2.9M | $443K |
| Mar 2022 | $3.2M | $498K |
| Feb 2022 | $2.9M | $443K |
| Jan 2022 | $3.4M | $525K |
| Dec 2021 | $3.1M | $469K |
| Nov 2021 | $2.8M | $409K |
| Oct 2021 | $2.9M | $422K |
| Sep 2021 | $2.9M | $438K |
| Aug 2021 | $3.2M | $479K |
| Jul 2021 | $2.6M | $391K |
| Jun 2021 | $2.4M | $366K |
| May 2021 | $2.6M | $397K |
| Apr 2021 | $2.4M | $370K |
| Mar 2021 | $2.4M | $380K |
| Feb 2021 | $2.5M | $373K |
| Jan 2021 | $2.7M | $433K |
| Dec 2020 | $2.7M | $428K |
| Nov 2020 | $2.4M | $375K |
| Oct 2020 | $2.4M | $388K |
| Sep 2020 | $2.4M | $380K |
| Aug 2020 | $2.7M | $437K |
| Jul 2020 | $3.0M | $478K |
| Jun 2020 | $3.2M | $510K |
| May 2020 | $4.6M | $730K |
| Apr 2020 | $5.3M | $838K |
| Mar 2020 | $3.1M | $500K |
| Feb 2020 | $1.8M | $291K |
| Jan 2020 | $2.2M | $345K |
| Dec 2019 | $2.5M | $396K |
| Nov 2019 | $2.0M | $314K |
| Year | Revenue (GGR) | State tax |
|---|---|---|
| 2026 | $21.3M (9 mo) | $3.3M (9 mo) |
| 2025 | $29.8M | $4.7M |
| 2024 | $28.1M | $4.4M |
| 2023 | $30.6M | $4.7M |
| 2022 | $33.7M | $5.2M |
| 2021 | $32.4M | $4.9M |
| 2020 | $35.9M | $5.7M |
| 2019 | $4.4M (2 mo) | $710K (2 mo) |
Years with missing months show partial totals, marked with the number of months reported.
| Operator | GGR |
|---|---|
| PENN Entertainment | $7.2M |
| Caesars Entertainment | $6.1M |
| Boyd Gaming | $5.4M |
| Rush Street Gaming | $5.3M |
| Mount Airy | $4.4M |
License-holder totals may include partner-operated brands.
Notes
GGR is poker rake and tournament fees. Tax paid is state tax plus local share assessments on interactive poker.