Arizona Daily Fantasy Sports Revenue and Handle by Month
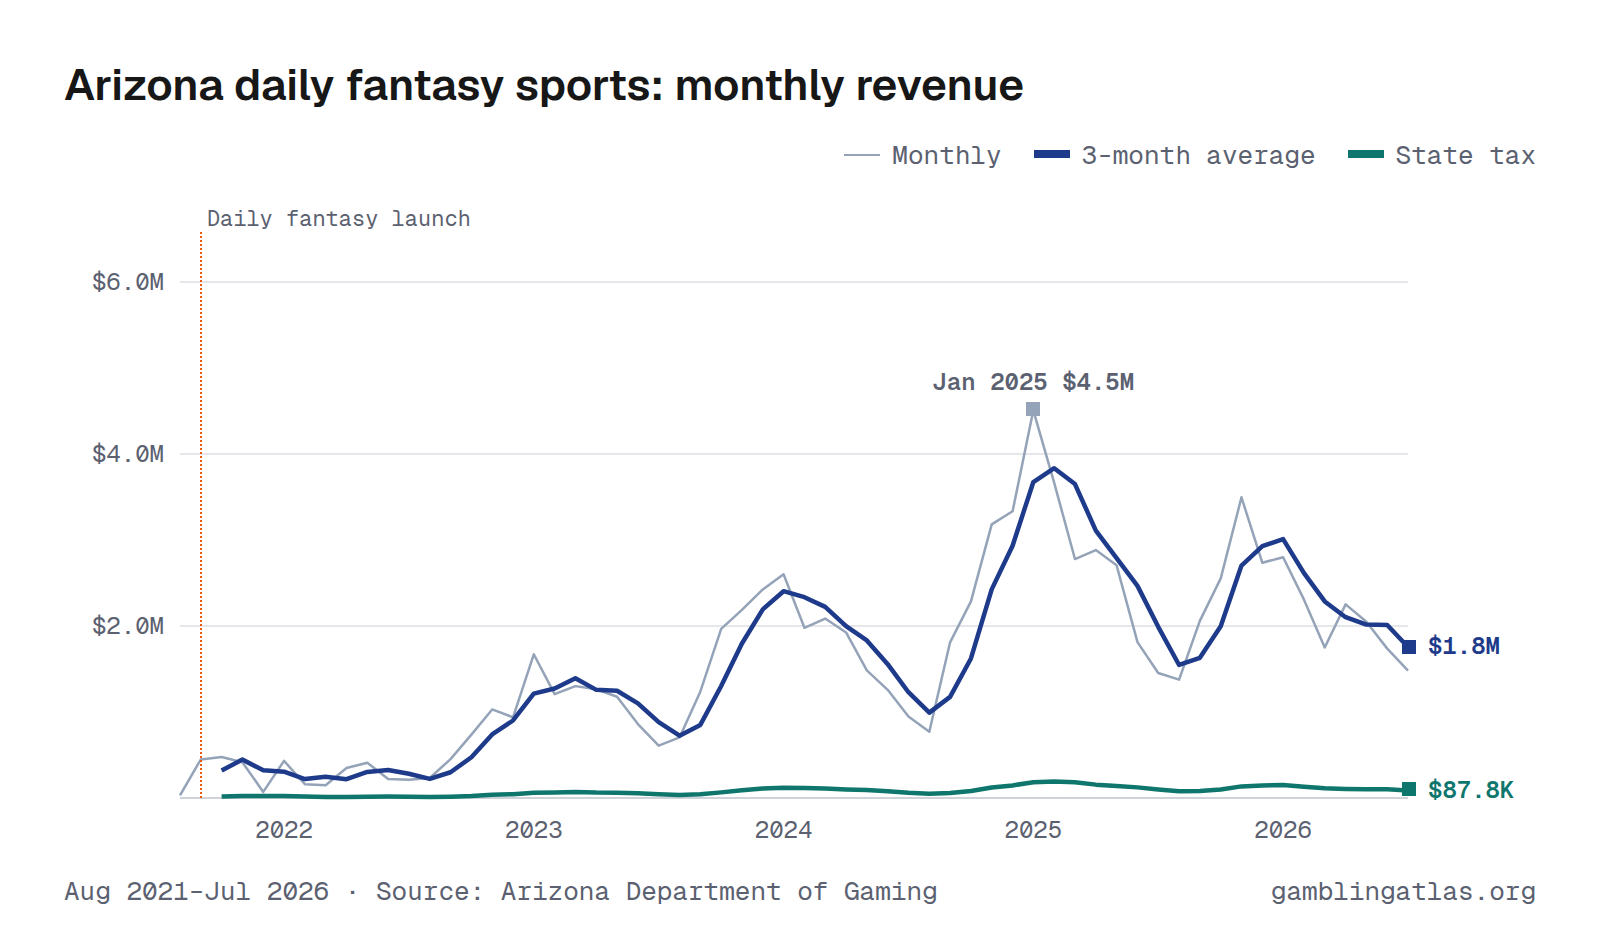
Arizona daily fantasy sports produced $1.5M in gross gaming revenue in July 2026, up 2% from Jul 2025. Over the 12 months through Jul 2026, revenue totaled $26.6M on $146M in bets, a 18.3% hold, and the state collected $1.3M in tax. In the shared comparison window Aug 2025–Jul 2026, it ranked 2nd largest of 8 states with monthly daily fantasy sports revenue.
The highest month on record here is Jan 2025 ($4.5M). Monthly figures run from Aug 2021 to Jul 2026 and come from the Arizona Department of Gaming.
Aug 2021–Jul 2026 · Source: Arizona Department of Gaming · Arizona revenue
Handle (amount bet)
Download, embed or cite
Free to reuse with a link to this page. License and sources
Data
| Month | Handle | Revenue (GGR) | Hold | State tax |
|---|---|---|---|---|
| Jul 2026 | $8.0M | $1.5M | 18.6% | $74.1K |
| Jun 2026 | $9.3M | $1.7M | 18.7% | $86.9K |
| May 2026 | $10.8M | $2.0M | 19.0% | $102K |
| Apr 2026 | $10.8M | $2.3M | 20.8% | $113K |
| Mar 2026 | $10.6M | $1.7M | 16.4% | $87.5K |
| Feb 2026 | $10.2M | $2.3M | 22.6% | $115K |
| Jan 2026 | $13.6M | $2.8M | 20.5% | $140K |
| Dec 2025 | $17.2M | $2.7M | 15.9% | $137K |
| Nov 2025 | $17.0M | $3.5M | 20.6% | $175K |
| Oct 2025 | $17.0M | $2.6M | 15.0% | $128K |
| Sep 2025 | $14.1M | $2.1M | 14.6% | $103K |
| Aug 2025 | $6.9M | $1.4M | 20.1% | $68.8K |
| Jul 2025 | $7.3M | $1.5M | 19.9% | $72.7K |
| Jun 2025 | $8.2M | $1.8M | 22.0% | $90.6K |
| May 2025 | $10.8M | $2.7M | 25.1% | $135K |
| Apr 2025 | $11.3M | $2.9M | 25.6% | $144K |
| Mar 2025 | $12.9M | $2.8M | 21.5% | $139K |
| Feb 2025 | $14.1M | $3.7M | 26.0% | $183K |
| Jan 2025 | $17.5M | $4.5M | 25.8% | $225K |
| Dec 2024 | $14.5M | $3.3M | 23.0% | $167K |
| Nov 2024 | $13.9M | $3.2M | 22.8% | $159K |
| Oct 2024 | $12.8M | $2.3M | 17.8% | $114K |
| Sep 2024 | $11.0M | $1.8M | 16.5% | $90.5K |
| Aug 2024 | $4.7M | $771K | 16.5% | $38.5K |
| Jul 2024 | $5.2M | $948K | 18.2% | $47.4K |
| Jun 2024 | $6.5M | $1.3M | 19.4% | $62.9K |
| May 2024 | $7.7M | $1.5M | 19.1% | $74.2K |
| Apr 2024 | $9.8M | $1.9M | 19.7% | $96.2K |
| Mar 2024 | $12.0M | $2.1M | 17.4% | $104K |
| Feb 2024 | $11.1M | $2.0M | 17.8% | $99.0K |
| Jan 2024 | $14.0M | $2.6M | 18.5% | $130K |
| Dec 2023 | $15.7M | $2.4M | 15.5% | $121K |
| Nov 2023 | $14.1M | $2.2M | 15.5% | $109K |
| Oct 2023 | $11.6M | $2.0M | 16.9% | $98.4K |
| Sep 2023 | $8.7M | $1.2M | 14.3% | $61.8K |
| Aug 2023 | $5.3M | $704K | 13.2% | $35.2K |
| Jul 2023 | $4.4M | $608K | 13.9% | $30.4K |
| Jun 2023 | $4.8M | $860K | 17.9% | $43.0K |
| May 2023 | $6.7M | $1.2M | 17.6% | $58.9K |
| Apr 2023 | $7.5M | $1.3M | 16.8% | $63.2K |
| Mar 2023 | $7.5M | $1.3M | 17.4% | $65.0K |
| Feb 2023 | $7.3M | $1.2M | 16.6% | $60.4K |
| Jan 2023 | $8.8M | $1.7M | 19.1% | $83.5K |
| Dec 2022 | $7.5M | $938K | 12.4% | $46.9K |
| Nov 2022 | $6.1M | $1.0M | 16.9% | $51.5K |
| Oct 2022 | $6.3M | $736K | 11.6% | $36.8K |
| Sep 2022 | $4.2M | $453K | 10.9% | $22.6K |
| Aug 2022 | $2.2M | $232K | 10.4% | $11.6K |
| Jul 2022 | $2.2M | $214K | 9.7% | $10.7K |
| Jun 2022 | $2.3M | $221K | 9.5% | $11.0K |
| May 2022 | $3.4M | $411K | 11.9% | $20.5K |
| Apr 2022 | $2.8M | $348K | 12.6% | $17.4K |
| Mar 2022 | $1.3M | $149K | 11.6% | $7,446 |
| Feb 2022 | $1.7M | $161K | 9.4% | $8,896 |
| Jan 2022 | $3.9M | $431K | 10.9% | $21.6K |
| Dec 2021 | $5.0M | $71.0K | 1.4% | $24.9K |
| Nov 2021 | $4.0M | $416K | 10.4% | $21.3K |
| Oct 2021 | $4.3M | $477K | 11.1% | $24.0K |
| Sep 2021 | $4.0M | $448K | 11.3% | $22.7K |
| Aug 2021 | $176K | $31.6K | 18.0% | $1,581 |
| Year | Handle | Revenue (GGR) | State tax |
|---|---|---|---|
| 2026 | $73.4M (7 mo) | $14.4M (7 mo) | $719K (7 mo) |
| 2025 | $154M | $32.0M | $1.6M |
| 2024 | $123M | $23.7M | $1.2M |
| 2023 | $102M | $16.6M | $830K |
| 2022 | $44.1M | $5.3M | $267K |
| 2021 | $17.4M (5 mo) | $1.4M (5 mo) | $94.6K (5 mo) |
Years with missing months show partial totals, marked with the number of months reported.
| Operator | Handle | GGR |
|---|---|---|
| PrizePicks | $59.7M | $13.5M |
| DraftKings | $46.0M | $5.3M |
| Underdog Fantasy | $19.2M | $4.5M |
| Betr | $6.4M | $1.6M |
| FanDuel | $10.5M | $1.1M |
| Dabble Fantasy | $627K | $220K |
| Splash Sports | $707K | $103K |
| ParlayPlay | $493K | $92.3K |
| FFPC | $397K | $88.0K |
| Yahoo Fantasy Sports | $1.2M | $84.5K |
| DataForce | $43.4K | $8,034 |
| RealTime Fantasy Sports | $49.3K | $5,620 |
| SportsHub Regulatory | $29.4K | $4,231 |
| OwnersBox | $256K | $3,959 |
| FastDraft | $10.3K | $710 |
License-holder totals may include partner-operated brands.
Notes
GGR is the fantasy sports report's "adjusted revenue" column. Tax paid is the report's "Privilege Fee 5% of Adj Revenue" column.
Sources
Related charts
Same chart for other states
Connecticut · Iowa · Louisiana · Maine · Massachusetts · Michigan · Pennsylvania