States / Massachusetts / Chart
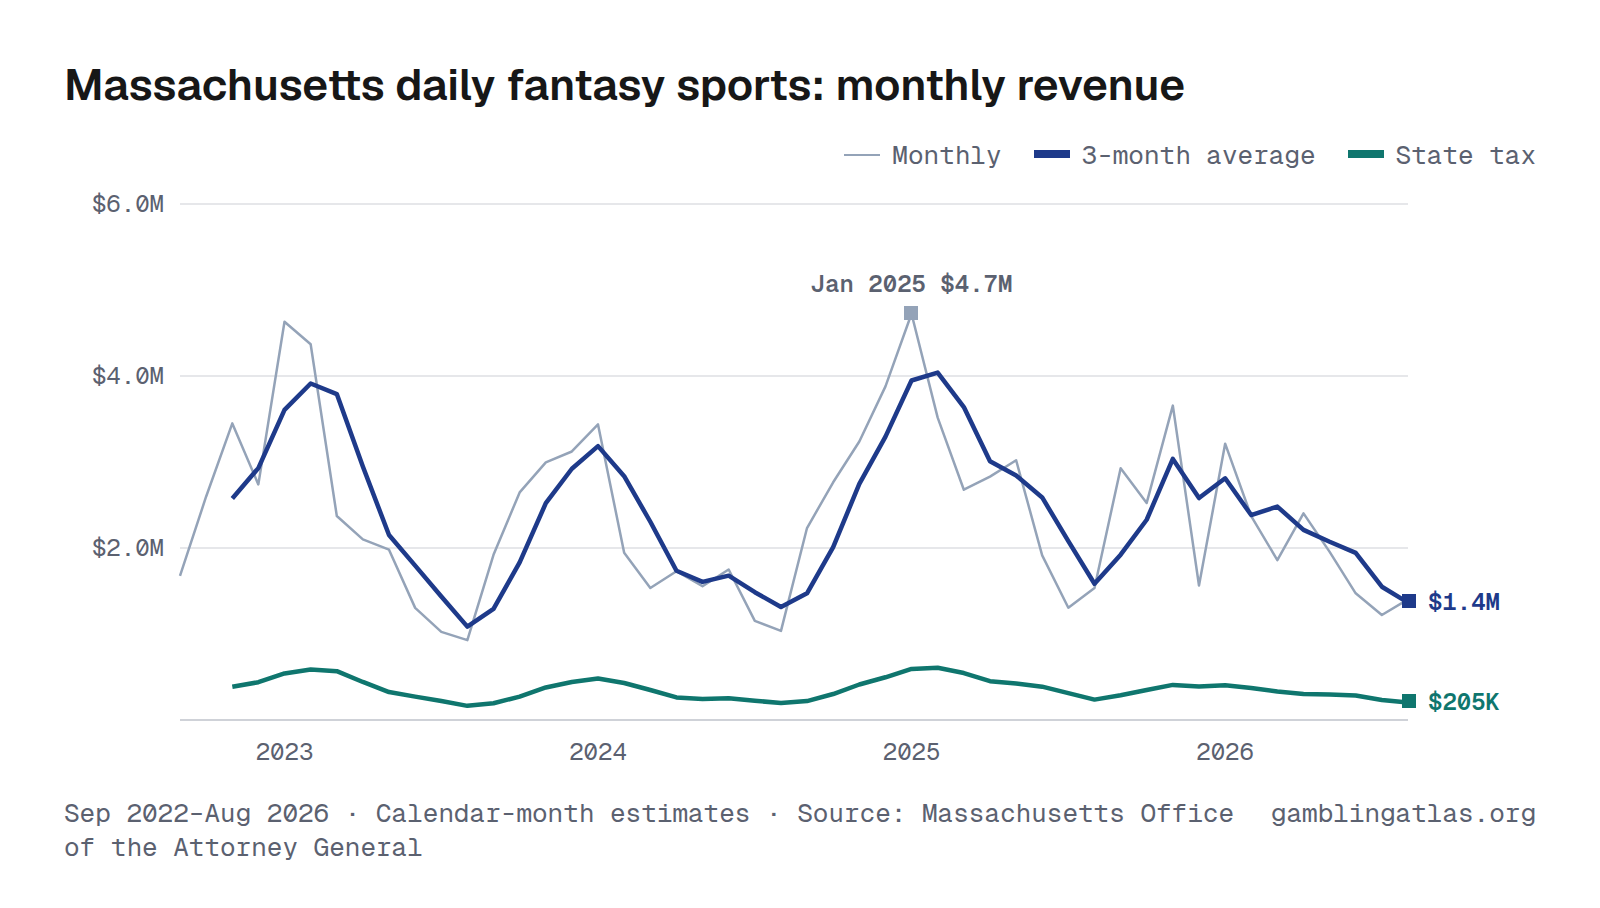
Massachusetts Daily Fantasy Sports Revenue and Handle by Month
Massachusetts daily fantasy sports produced $1.4M in gross gaming revenue in August 2026, down 9% from Aug 2025. Over the 12 months through Aug 2026, revenue totaled $26.6M on $178M in bets, a 15.0% hold, and the state collected $3.8M in tax. In the shared comparison window Aug 2025–Jul 2026, it ranked largest of 8 states with monthly daily fantasy sports revenue.
The highest month on record here is Jan 2025 ($4.7M). Monthly figures run from Sep 2022 to Aug 2026 and come from the Massachusetts Office of the Attorney General.
Reports spanning calendar months are allocated evenly across their days; monthly values are estimates. Months without complete reporting coverage are omitted.
Sep 2022–Aug 2026 · Calendar-month estimates · Source: Massachusetts Office of the Attorney General · Massachusetts revenue
Handle (amount bet)
Download, embed or cite
Free to reuse with a link to this page. License and sources
Data
| Month | Handle | Revenue (GGR) | Hold | State tax |
|---|---|---|---|---|
| Aug 2026 | $7.7M | $1.4M | 18.3% | $209K |
| Jul 2026 | $8.3M | $1.2M | 14.7% | $184K |
| Jun 2026 | $9.5M | $1.5M | 15.5% | $221K |
| May 2026 | $11.5M | $2.0M | 16.9% | $293K |
| Apr 2026 | $13.2M | $2.4M | 18.1% | $343K |
| Mar 2026 | $12.9M | $1.9M | 14.4% | $255K |
| Feb 2026 | $12.0M | $2.4M | 19.7% | $312K |
| Jan 2026 | $18.4M | $3.2M | 17.4% | $425K |
| Dec 2025 | $24.3M | $1.6M | 6.4% | $379K |
| Nov 2025 | $21.4M | $3.7M | 17.1% | $407K |
| Oct 2025 | $20.5M | $2.5M | 12.3% | $380K |
| Sep 2025 | $17.8M | $2.9M | 16.4% | $438K |
| Aug 2025 | $10.0M | $1.5M | 15.3% | $227K |
| Jul 2025 | $8.6M | $1.3M | 15.1% | $198K |
| Jun 2025 | $10.6M | $1.9M | 18.0% | $287K |
| May 2025 | $13.3M | $3.0M | 22.7% | $451K |
| Apr 2025 | $14.8M | $2.8M | 19.1% | $425K |
| Mar 2025 | $14.9M | $2.7M | 18.0% | $400K |
| Feb 2025 | $16.6M | $3.5M | 21.1% | $529K |
| Jan 2025 | $24.0M | $4.7M | 19.7% | $710K |
| Dec 2024 | $23.4M | $3.9M | 16.6% | $585K |
| Nov 2024 | $19.5M | $3.2M | 16.6% | $487K |
| Oct 2024 | $19.5M | $2.8M | 14.2% | $418K |
| Sep 2024 | $17.5M | $2.2M | 12.8% | $333K |
| Aug 2024 | $7.2M | $1.0M | 14.5% | $155K |
| Jul 2024 | $8.1M | $1.2M | 14.2% | $171K |
| Jun 2024 | $10.4M | $1.8M | 16.8% | $266K |
| May 2024 | $11.2M | $1.6M | 13.9% | $234K |
| Apr 2024 | $12.3M | $1.7M | 14.1% | $261K |
| Mar 2024 | $13.1M | $1.5M | 11.7% | $235K |
| Feb 2024 | $14.7M | $1.9M | 13.2% | $293K |
| Jan 2024 | $24.8M | $3.4M | 13.8% | $520K |
| Dec 2023 | $26.5M | $3.1M | 11.8% | $477K |
| Nov 2023 | $23.8M | $3.0M | 12.6% | $452K |
| Oct 2023 | $27.4M | $2.6M | 9.7% | $397K |
| Sep 2023 | $16.8M | $1.9M | 11.4% | $286K |
| Aug 2023 | $11.5M | $928K | 8.1% | $134K |
| Jul 2023 | $16.0M | $1.0M | 6.4% | $162K |
| Jun 2023 | $11.4M | $1.3M | 11.5% | $196K |
| May 2023 | $14.7M | $2.0M | 13.4% | $303K |
| Apr 2023 | $15.7M | $2.1M | 13.4% | $315K |
| Mar 2023 | $17.3M | $2.4M | 13.7% | $356K |
| Feb 2023 | $38.8M | $4.4M | 11.3% | $655K |
| Jan 2023 | $24.5M | $4.6M | 18.9% | $694K |
| Dec 2022 | $21.7M | $2.7M | 12.6% | $411K |
| Nov 2022 | $20.4M | $3.4M | 16.9% | $518K |
| Oct 2022 | $21.6M | $2.6M | 12.0% | $390K |
| Sep 2022 | $14.2M | $1.7M | 11.8% | $252K |
| Year | Handle | Revenue (GGR) | State tax |
|---|---|---|---|
| 2026 | $93.6M (8 mo) | $15.9M (8 mo) | $2.2M (8 mo) |
| 2025 | $197M | $32.2M | $4.8M |
| 2024 | $182M | $26.3M | $4.0M |
| 2023 | $244M | $29.4M | $4.4M |
| 2022 | $78.0M (4 mo) | $10.5M (4 mo) | $1.6M (4 mo) |
Years with missing months show partial totals, marked with the number of months reported.
| Operator | Handle | GGR |
|---|---|---|
| PrizePicks | $48.4M | $14.1M |
| DraftKings | $61.9M | $7.6M |
| Crown Draft Kings (unmatched) | $23.3M | $3.5M |
| Underdog Fantasy | $15.1M | $3.0M |
| FanDuel | $14.8M | $1.5M |
| Prize Pick (unmatched) | $11.0M | $1.3M |
| Sleepers (unmatched) | $4.7M | $1.1M |
| Underdog Sport (unmatched) | $4.7M | $852K |
| ParlayPlay | $796K | $220K |
| Dabble Fantasy | $1.1M | $216K |
| Yahoo Fantasy (unmatched) | $3.0M | $163K |
| FFPC | $623K | $120K |
| SCHLEP Games (unmatched) | $1.2M | $106K |
| Betr | $399K | $86.3K |
| Yahoo Fantasy Sports | $1.3M | $80.8K |
| SHGN (unmatched) | $497K | $69.2K |
| Splash Sports | $331K | $38.2K |
| Boom Shalaka (unmatched) | $58.5K | $21.8K |
| RealTime Fantasy (unmatched) | $211K | $21.2K |
| FanTrax (unmatched) | $17.5K | $4,526 |
| OwnersBox | $298K | $4,497 |
| RealTime Fantasy Sports | $31.0K | $4,480 |
| SCHLEP GAMES (unmatched) | $43.1K | $3,768 |
| Fantasy Spin (unmatched) | $37.6K | $1,985 |
| Real Time Fantasy (unmatched) | $2,968 | $265 |
| StatHero | $8,181 | $112 |
| FANSPOKO'S (unmatched) | $0 | $0 |
| Flexbets | $0 | $0 |
| Verse Fantasy (unmatched) | $1,003 | −$1,221 |
| FastDraft | $5,439 | −$1,877 |
| PREDICTIONSTRIKE (unmatched) | $6,290 | −$2,380 |
| Prediction Strike (unmatched) | $322K | −$5,611 |
| PredictionStrike (unmatched) | $91.6K | −$10.5K |
License-holder totals may include partner-operated brands. “(unmatched)” rows show the regulator's reported name with no linked operator record here — that can be an operator not yet matched, or a non-operator reporting channel (e.g. a lottery's own retail-location sales) rather than a licensed sportsbook or casino.
Notes
Online: GGR is the report's "Adjusted Gross Fantasy Wagering Receipts" line (gross fantasy wagering receipts less cash prizes paid to participants), before promotional credits. Adjusted revenue is the report's "Net Adjusted Gross Fantasy Wagering Receipts" line (the taxable base, after the prior month's negative-receipts carry-forward). Tax paid is the fantasy-contest excise tax under M.G.L. c.23N Sec. 14 (15% of adjusted gross fantasy wagering receipts). The combined monthly MGC Revenue Report did not add a Daily Fantasy Sports page until the August 2023 report; 2022-08-10 (the tax's effective date) through 2023-07-31 instead uses the Annual Report's own month-by-month "Total Fantasy Sports Wagering Tax Revenue" table (the Commission's annual Sec. 14(d) publication, due by July 1 each year). Monthly reports from roughly 2024 onward stopped printing a per-operator breakdown and give only a combined total.
Sources
- MGC August 2026 Fantasy Sports Wagering Tax Report: revised February 2024 history
- MGC August 2026 Fantasy Sports Wagering Tax Report: revised July 2023 history
- MGC August 2026 Fantasy Sports Wagering Tax Report: revised October 2025 history
- MGC August 2026 Fantasy Sports Wagering Tax Report: revised September 2025 history
- MGC FY2023 Annual Report, Total Fantasy Sports Wagering Tax Revenue
- MGC Monthly Revenue Report (combined)
Related charts
Same chart for other states
Arizona · Connecticut · Iowa · Louisiana · Maine · Michigan · Pennsylvania