Iowa Daily Fantasy Sports Revenue and Handle by Month
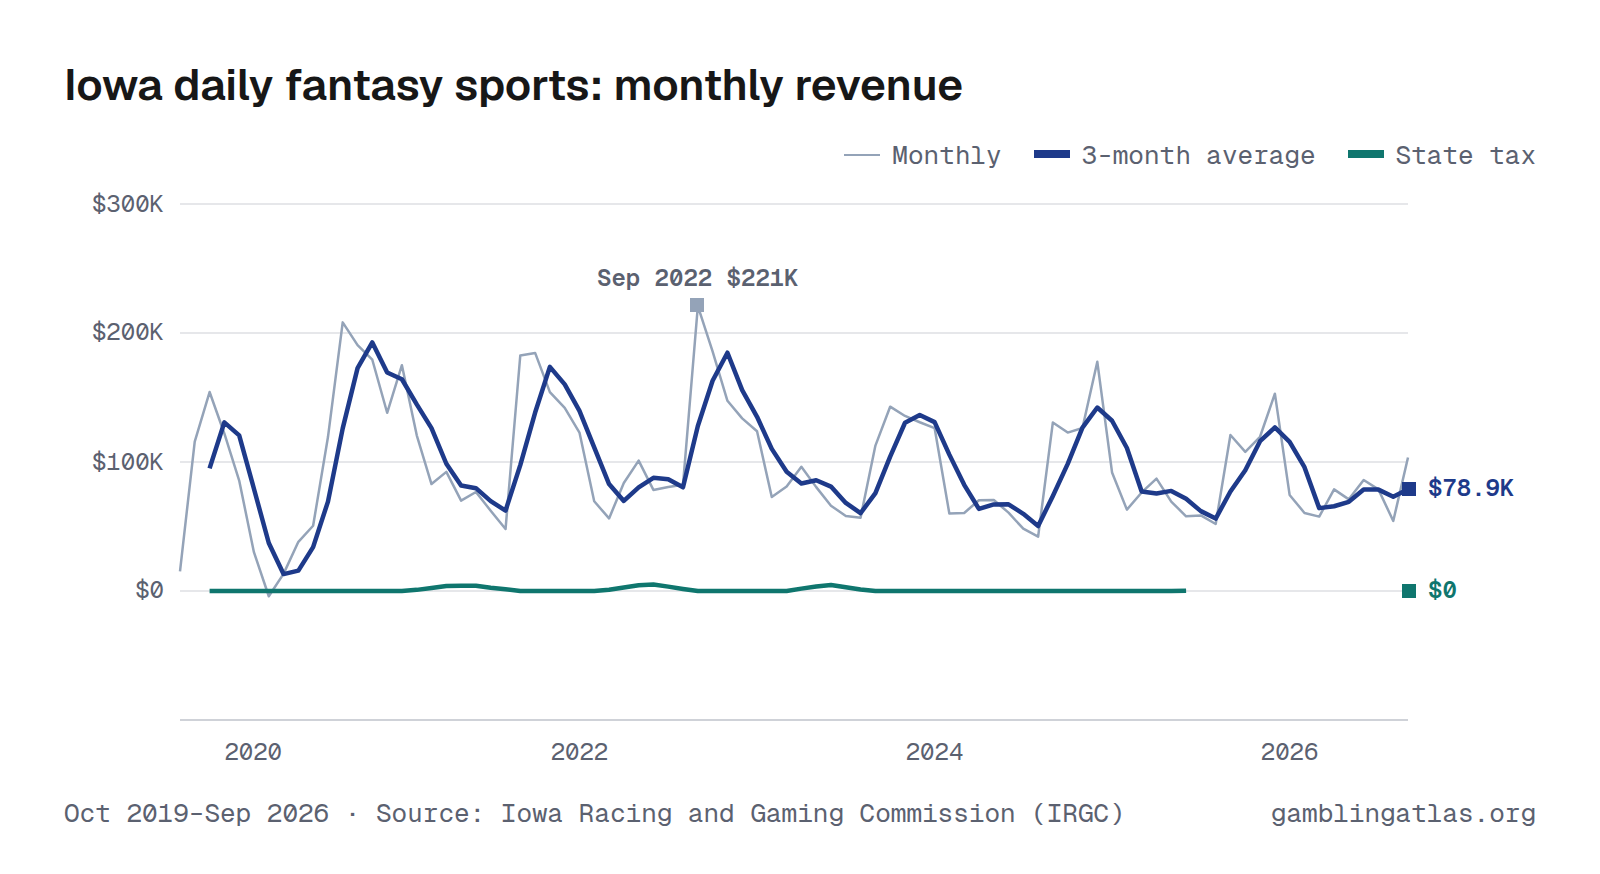
Iowa daily fantasy sports produced $104K in adjusted gross revenue in September 2026, down 14% from Sep 2025. Over the 12 months through Sep 2026, revenue totaled $1.0M on $9.9M in bets. In the shared comparison window Aug 2025–Jul 2026, it ranked 8th largest of 8 states with monthly daily fantasy sports revenue.
The highest month on record here is Sep 2022 ($221K). Monthly figures run from Oct 2019 to Sep 2026 and come from the Iowa Racing and Gaming Commission (IRGC).
Adjusted revenue was below zero in April 2020 (−$4,071): winnings paid and deductions such as promotional credits exceeded the amount bet.
Oct 2019–Sep 2026 · Source: Iowa Racing and Gaming Commission (IRGC) · Iowa revenue
Handle (amount bet)
Download, embed or cite
Free to reuse with a link to this page. License and sources
Data
| Month | Handle | Revenue (AGR) | State tax |
|---|---|---|---|
| Sep 2026 | $876K | $104K | $0 |
| Aug 2026 | $480K | $54.3K | $0 |
| Jul 2026 | $730K | $78.8K | $0 |
| Jun 2026 | $776K | $86.0K | |
| May 2026 | $642K | $71.0K | |
| Apr 2026 | $749K | $78.8K | $0 |
| Mar 2026 | $551K | $57.7K | $0 |
| Feb 2026 | $664K | $60.5K | |
| Jan 2026 | $623K | $74.5K | |
| Dec 2025 | $2.0M | $153K | |
| Nov 2025 | $952K | $120K | |
| Oct 2025 | $845K | $108K | |
| Sep 2025 | $1.1M | $121K | |
| Aug 2025 | $490K | $51.9K | |
| Jul 2025 | $504K | $58.6K | |
| Jun 2025 | $501K | $57.9K | $742 |
| May 2025 | $593K | $69.3K | $0 |
| Apr 2025 | $612K | $87.1K | $0 |
| Mar 2025 | $644K | $76.4K | $0 |
| Feb 2025 | $525K | $63.1K | $0 |
| Jan 2025 | $756K | $91.9K | $0 |
| Dec 2024 | $1.4M | $178K | $0 |
| Nov 2024 | $1.0M | $126K | $0 |
| Oct 2024 | $1.0M | $123K | $0 |
| Sep 2024 | $1.1M | $131K | $0 |
| Aug 2024 | $356K | $42.1K | $0 |
| Jul 2024 | $440K | $48.3K | $0 |
| Jun 2024 | $579K | $60.7K | $156 |
| May 2024 | $652K | $70.5K | $0 |
| Apr 2024 | $614K | $70.3K | $0 |
| Mar 2024 | $517K | $60.5K | $0 |
| Feb 2024 | $575K | $60.1K | $0 |
| Jan 2024 | $1.1M | $126K | $0 |
| Dec 2023 | $1.1M | $131K | $0 |
| Nov 2023 | $1.1M | $136K | $0 |
| Oct 2023 | $1.2M | $143K | $0 |
| Sep 2023 | $965K | $113K | $0 |
| Aug 2023 | $504K | $56.8K | $0 |
| Jul 2023 | $576K | $58.1K | $0 |
| Jun 2023 | $606K | $66.2K | $3,699 |
| May 2023 | $716K | $80.5K | $4,787 |
| Apr 2023 | $895K | $96.2K | $5,514 |
| Mar 2023 | $739K | $80.9K | $0 |
| Feb 2023 | $711K | $72.9K | $0 |
| Jan 2023 | $1.1M | $124K | $0 |
| Dec 2022 | $1.3M | $134K | $0 |
| Nov 2022 | $1.3M | $147K | $0 |
| Oct 2022 | $1.6M | $186K | $0 |
| Sep 2022 | $1.2M | $221K | $0 |
| Aug 2022 | $813K | $82.3K | $0 |
| Jul 2022 | $761K | $80.6K | $0 |
| Jun 2022 | $769K | $78.3K | $4,827 |
| May 2022 | $283K | $101K | $5,426 |
| Apr 2022 | $753K | $83.7K | $4,833 |
| Mar 2022 | $485K | $56.3K | $3,112 |
| Feb 2022 | $534K | $69.6K | $0 |
| Jan 2022 | $1.1M | $123K | $0 |
| Dec 2021 | $1.3M | $142K | $0 |
| Nov 2021 | $1.2M | $154K | $0 |
| Oct 2021 | $1.6M | $185K | $0 |
| Sep 2021 | $1.2M | $183K | $0 |
| Aug 2021 | $485K | $48.0K | $0 |
| Jul 2021 | $535K | $62.2K | $0 |
| Jun 2021 | $643K | $76.7K | $4,166 |
| May 2021 | $484K | $70.1K | $3,455 |
| Apr 2021 | $760K | $92.3K | $4,661 |
| Mar 2021 | $697K | $82.9K | $4,178 |
| Feb 2021 | $994K | $121K | $2,648 |
| Jan 2021 | $1.4M | $175K | $0 |
| Dec 2020 | $1.5M | $138K | $0 |
| Nov 2020 | $1.5M | $179K | $0 |
| Oct 2020 | $1.6M | $191K | $0 |
| Sep 2020 | $1.5M | $208K | $0 |
| Aug 2020 | $1.1M | $119K | $0 |
| Jul 2020 | $625K | $50.6K | $0 |
| Jun 2020 | $349K | $38.1K | $0 |
| May 2020 | $140K | $13.3K | $0 |
| Apr 2020 | $0 | −$4,071 | $0 |
| Mar 2020 | $245K | $30.1K | $0 |
| Feb 2020 | $693K | $85.6K | $0 |
| Jan 2020 | $976K | $122K | $0 |
| Dec 2019 | $1.3M | $154K | $0 |
| Nov 2019 | $904K | $116K | $0 |
| Oct 2019 | $123K | $15.1K | $0 |
| Year | Handle | Revenue (AGR) | State tax |
|---|---|---|---|
| 2026 | $6.1M (9 mo) | $665K (9 mo) | $0 (5 mo) |
| 2025 | $9.5M | $1.1M | $742 (6 mo) |
| 2024 | $9.4M | $1.1M | $156 |
| 2023 | $10.2M | $1.2M | $14.0K |
| 2022 | $11.0M | $1.4M | $18.2K |
| 2021 | $11.3M | $1.4M | $19.1K |
| 2020 | $10.1M | $1.2M | $0 |
| 2019 | $2.3M (3 mo) | $285K (3 mo) | $0 (3 mo) |
Years with missing months show partial totals, marked with the number of months reported.
| Operator | Handle | GGR |
|---|---|---|
| DraftKings | $9.2M | $975K |
| FanDuel | $683K | $70.1K |
License-holder totals may include partner-operated brands.
Notes
Adjusted revenue is the report's "Fantasy Sports Revenue" line, the statutory adjusted-revenue tax base. Tax paid is the report's "State Tax" line. The report prints one column per licensed operator with no statewide total column; the total series here is the sum of those columns.
Sources
Related charts
Same chart for other states
Arizona · Connecticut · Louisiana · Maine · Massachusetts · Michigan · Pennsylvania