States / Connecticut / Chart
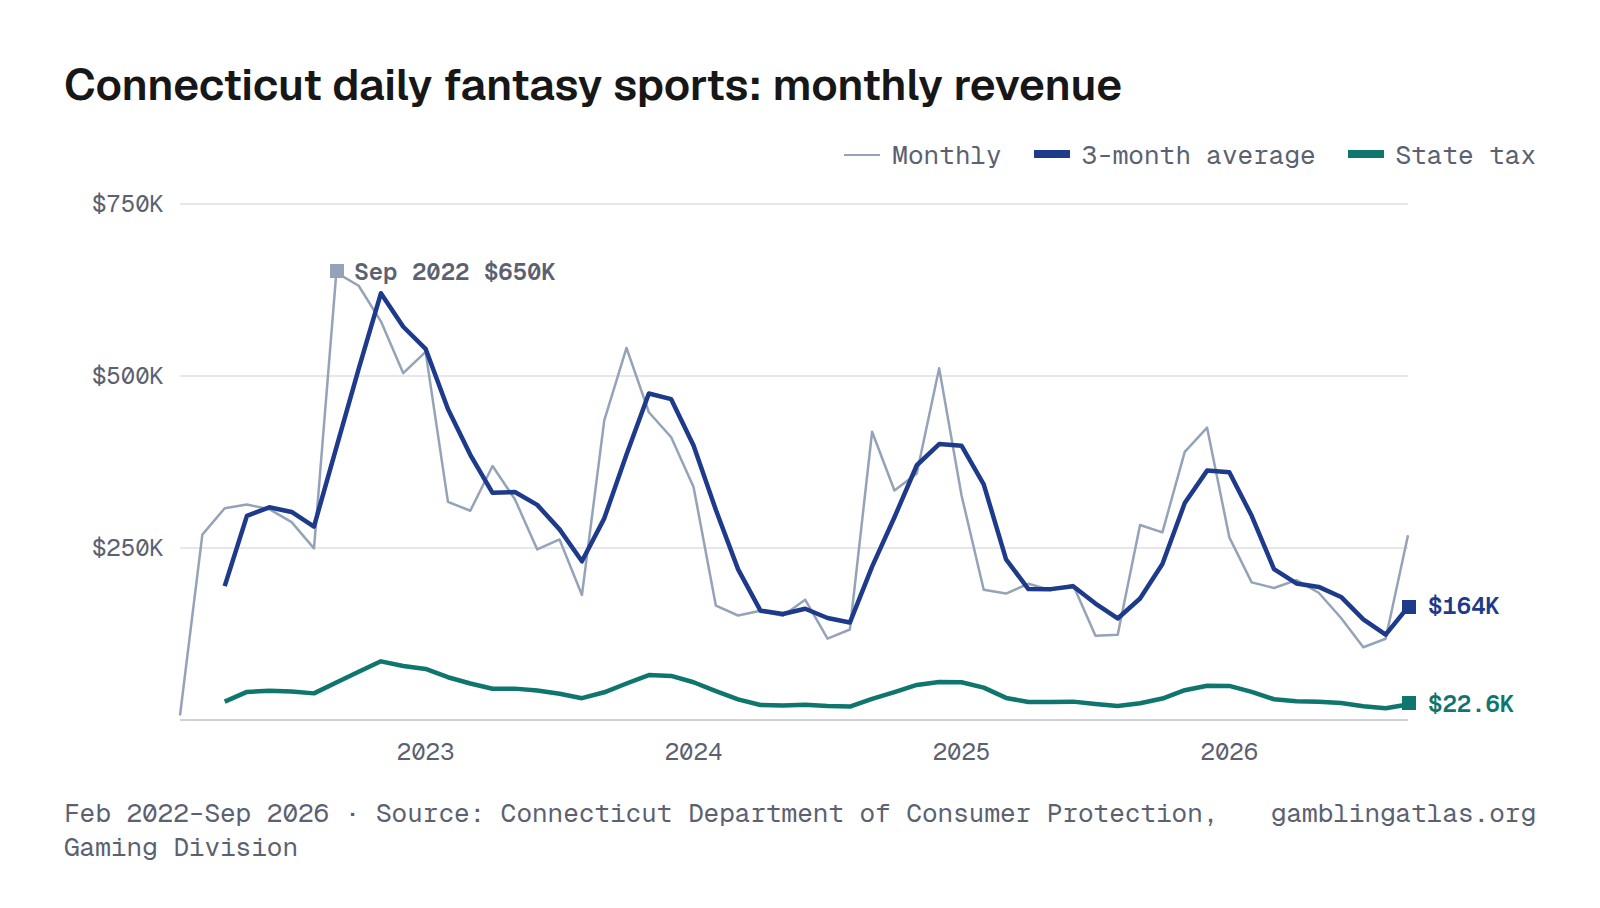
Connecticut Daily Fantasy Sports Revenue and Handle by Month
Connecticut daily fantasy sports produced $269K in gross gaming revenue in September 2026, down 5% from Sep 2025. Over the 12 months through Sep 2026, revenue totaled $2.8M on $25.9M in bets, a 10.7% hold, and the state collected $381K in tax. In the shared comparison window Aug 2025–Jul 2026, it ranked 6th largest of 8 states with monthly daily fantasy sports revenue.
The highest month on record here is Sep 2022 ($650K). Monthly figures run from Feb 2022 to Sep 2026 and come from the Connecticut Department of Consumer Protection, Gaming Division.
Feb 2022–Sep 2026 · Source: Connecticut Department of Consumer Protection, Gaming Division · Connecticut revenue
Handle (amount bet)
Download, embed or cite
Free to reuse with a link to this page. License and sources
Data
| Month | Handle | Revenue (GGR) | Hold | State tax |
|---|---|---|---|---|
| Sep 2026 | $2.4M | $269K | 11.1% | $36.9K |
| Aug 2026 | $1.0M | $118K | 11.3% | $16.2K |
| Jul 2026 | $951K | $106K | 11.1% | $14.5K |
| Jun 2026 | $1.3M | $148K | 11.4% | $20.4K |
| May 2026 | $1.6M | $185K | 11.7% | $25.4K |
| Apr 2026 | $1.8M | $203K | 11.1% | $28.0K |
| Mar 2026 | $1.6M | $192K | 11.8% | $26.4K |
| Feb 2026 | $1.9M | $200K | 10.7% | $27.5K |
| Jan 2026 | $2.4M | $265K | 11.0% | $36.5K |
| Dec 2025 | $4.8M | $425K | 8.9% | $58.4K |
| Nov 2025 | $3.5M | $390K | 11.2% | $53.6K |
| Oct 2025 | $2.6M | $273K | 10.6% | $37.5K |
| Sep 2025 | $2.6M | $283K | 10.7% | $39.0K |
| Aug 2025 | $1.1M | $124K | 11.0% | $17.0K |
| Jul 2025 | $1.2M | $122K | 10.3% | $16.8K |
| Jun 2025 | $1.8M | $196K | 11.1% | $27.0K |
| May 2025 | $1.5M | $189K | 12.5% | $26.0K |
| Apr 2025 | $1.7M | $198K | 11.6% | $27.2K |
| Mar 2025 | $1.5M | $184K | 11.9% | $25.3K |
| Feb 2025 | $1.5M | $189K | 12.8% | $26.0K |
| Jan 2025 | $2.7M | $327K | 12.2% | $44.9K |
| Dec 2024 | $4.9M | $511K | 10.5% | $70.3K |
| Nov 2024 | $3.0M | $358K | 12.1% | $49.2K |
| Oct 2024 | $2.9M | $334K | 11.7% | $45.9K |
| Sep 2024 | $3.5M | $419K | 12.1% | $57.6K |
| Aug 2024 | $1.3M | $132K | 10.3% | $18.1K |
| Jul 2024 | $1.1M | $118K | 10.4% | $16.3K |
| Jun 2024 | $1.8M | $175K | 9.5% | $24.1K |
| May 2024 | $1.6M | $152K | 9.5% | $20.8K |
| Apr 2024 | $1.5M | $159K | 10.4% | $21.8K |
| Mar 2024 | $1.5M | $152K | 9.8% | $20.9K |
| Feb 2024 | $1.6M | $166K | 10.2% | $22.9K |
| Jan 2024 | $4.1M | $339K | 8.2% | $46.6K |
| Dec 2023 | $3.8M | $411K | 10.8% | $56.5K |
| Nov 2023 | $4.3M | $447K | 10.3% | $61.5K |
| Oct 2023 | $5.1M | $541K | 10.7% | $74.4K |
| Sep 2023 | $4.1M | $435K | 10.6% | $59.9K |
| Aug 2023 | $1.8M | $182K | 10.2% | $25.0K |
| Jul 2023 | $2.8M | $262K | 9.4% | $36.1K |
| Jun 2023 | $2.4M | $248K | 10.2% | $34.1K |
| May 2023 | $3.1M | $321K | 10.4% | $44.1K |
| Apr 2023 | $3.7M | $369K | 10.1% | $50.8K |
| Mar 2023 | $3.0M | $304K | 10.3% | $41.8K |
| Feb 2023 | $3.2M | $317K | 10.0% | $43.6K |
| Jan 2023 | $5.3M | $535K | 10.1% | $73.6K |
| Dec 2022 | $5.0M | $504K | 10.1% | $69.3K |
| Nov 2022 | $5.2M | $579K | 11.2% | $79.7K |
| Oct 2022 | $6.0M | $631K | 10.5% | $86.8K |
| Sep 2022 | $4.7M | $650K | 13.8% | $89.4K |
| Aug 2022 | $2.5M | $249K | 10.2% | $34.3K |
| Jul 2022 | $2.8M | $288K | 10.2% | $39.5K |
| Jun 2022 | $3.0M | $306K | 10.1% | $42.1K |
| May 2022 | $3.1M | $313K | 10.1% | $43.1K |
| Apr 2022 | $3.0M | $308K | 10.2% | $42.3K |
| Mar 2022 | $2.7M | $269K | 10.0% | $37.0K |
| Feb 2022 | $61.1K | $6,499 | 10.6% | $894 |
| Year | Handle | Revenue (GGR) | State tax |
|---|---|---|---|
| 2026 | $15.0M (9 mo) | $1.7M (9 mo) | $232K (9 mo) |
| 2025 | $26.5M | $2.9M | $399K |
| 2024 | $28.8M | $3.0M | $414K |
| 2023 | $42.5M | $4.4M | $601K |
| 2022 | $38.0M (11 mo) | $4.1M (11 mo) | $564K (11 mo) |
Years with missing months show partial totals, marked with the number of months reported.
| Operator | Handle | GGR |
|---|---|---|
| Mashantucket Pequot Tribal Nation | $25.9M | $2.8M |
License-holder totals may include partner-operated brands.
Notes
GGR is fantasy contest revenue apportioned to Connecticut, the schedule's own "in state total fantasy contest" figure (the operator's nationwide entry fees and patron winnings multiplied by a printed Connecticut location percentage); only one licensee has ever filed. Tax paid is state tax on fantasy contest revenue (13.75% of the Connecticut-apportioned figure). Published as the "Schedule of Selected Fantasy Sports Wagering Data" open-data table on data.ct.gov, the same figures behind DCP's monthly PDF schedule.
Sources
Related charts
Same chart for other states
Arizona · Iowa · Louisiana · Maine · Massachusetts · Michigan · Pennsylvania