Michigan Daily Fantasy Sports Revenue by Month
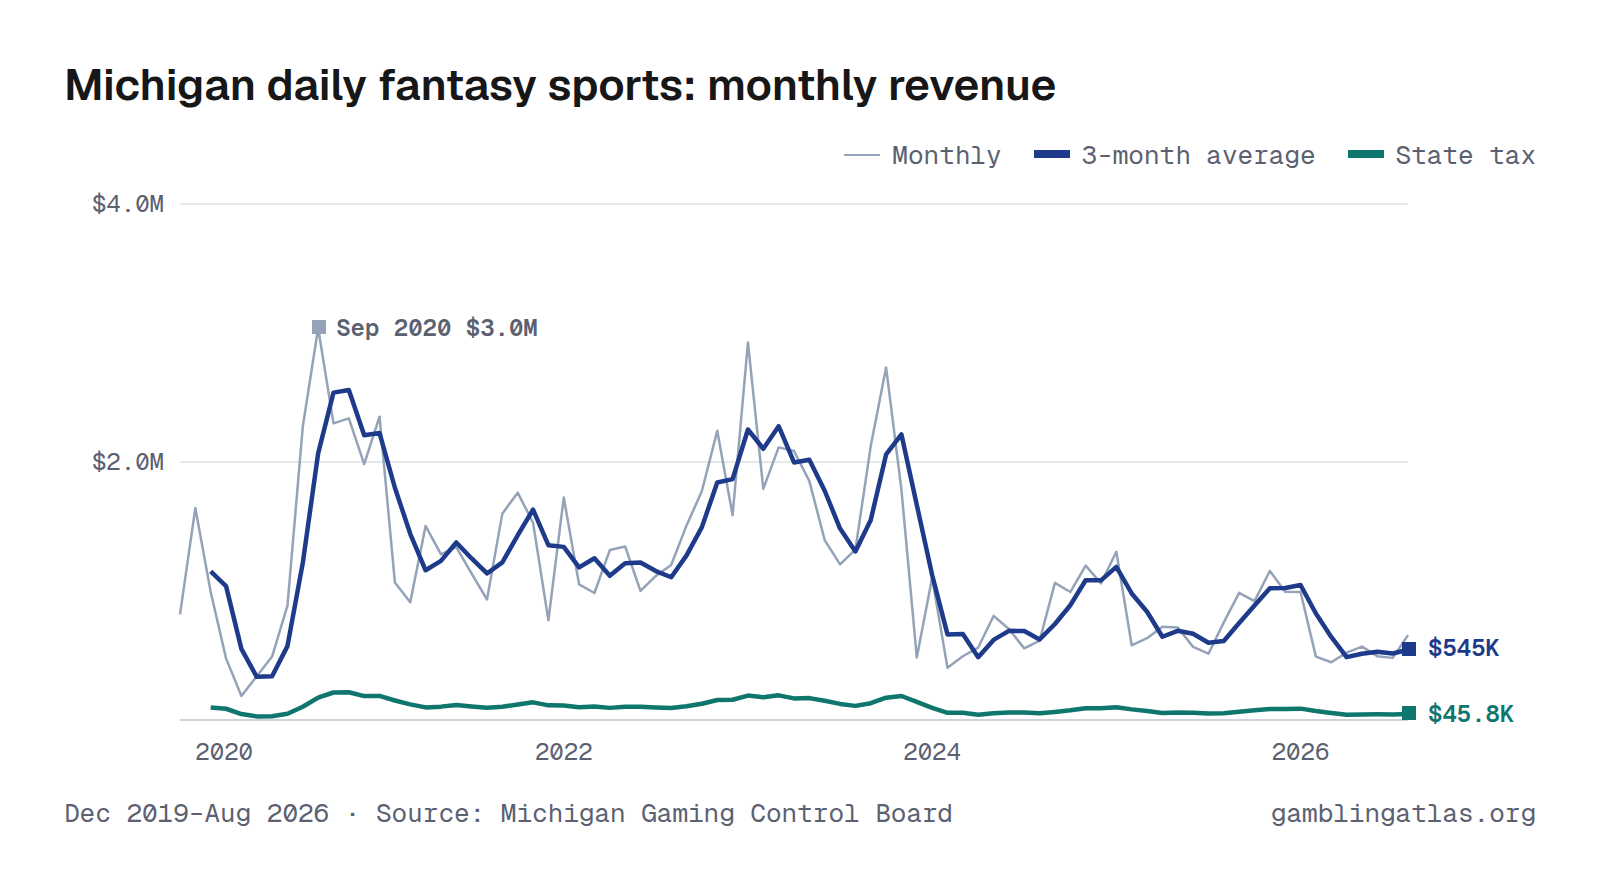
Michigan daily fantasy sports produced $658K in adjusted gross revenue in August 2026, down 13% from Aug 2025. Over the 12 months through Aug 2026, revenue totaled $8.7M, and the state collected $732K in tax. In the shared comparison window Aug 2025–Jul 2026, it ranked 4th largest of 8 states with monthly daily fantasy sports revenue.
The highest month on record here is Sep 2020 ($3.0M). Monthly figures run from Dec 2019 to Aug 2026 and come from the Michigan Gaming Control Board.
Dec 2019–Aug 2026 · Source: Michigan Gaming Control Board · Michigan revenue
Download, embed or cite
Free to reuse with a link to this page. License and sources
Data
| Month | Revenue (AGR) | State tax |
|---|---|---|
| Aug 2026 | $658K | $55.3K |
| Jul 2026 | $481K | $40.4K |
| Jun 2026 | $495K | $41.6K |
| May 2026 | $569K | $47.8K |
| Apr 2026 | $522K | $43.9K |
| Mar 2026 | $448K | $37.6K |
| Feb 2026 | $491K | $41.3K |
| Jan 2026 | $992K | $83.3K |
| Dec 2025 | $994K | $83.5K |
| Nov 2025 | $1.2M | $97.0K |
| Oct 2025 | $921K | $77.4K |
| Sep 2025 | $986K | $82.8K |
| Aug 2025 | $757K | $63.6K |
| Jul 2025 | $514K | $43.2K |
| Jun 2025 | $567K | $47.6K |
| May 2025 | $717K | $60.2K |
| Apr 2025 | $723K | $60.7K |
| Mar 2025 | $634K | $53.3K |
| Feb 2025 | $579K | $48.7K |
| Jan 2025 | $1.3M | $110K |
| Dec 2024 | $1.1M | $89.0K |
| Nov 2024 | $1.2M | $100K |
| Oct 2024 | $992K | $83.3K |
| Sep 2024 | $1.1M | $89.3K |
| Aug 2024 | $614K | $51.6K |
| Jul 2024 | $555K | $46.6K |
| Jun 2024 | $705K | $59.2K |
| May 2024 | $807K | $67.8K |
| Apr 2024 | $561K | $47.2K |
| Mar 2024 | $494K | $41.5K |
| Feb 2024 | $405K | $34.0K |
| Jan 2024 | $1.1M | $92.6K |
| Dec 2023 | $484K | $40.7K |
| Nov 2023 | $1.8M | $150K |
| Oct 2023 | $2.7M | $230K |
| Sep 2023 | $2.1M | $178K |
| Aug 2023 | $1.3M | $111K |
| Jul 2023 | $1.2M | $101K |
| Jun 2023 | $1.4M | $117K |
| May 2023 | $1.9M | $156K |
| Apr 2023 | $2.1M | $175K |
| Mar 2023 | $2.1M | $178K |
| Feb 2023 | $1.8M | $150K |
| Jan 2023 | $2.9M | $246K |
| Dec 2022 | $1.6M | $133K |
| Nov 2022 | $2.2M | $188K |
| Oct 2022 | $1.8M | $149K |
| Sep 2022 | $1.5M | $127K |
| Aug 2022 | $1.2M | $101K |
| Jul 2022 | $1.1M | $93.8K |
| Jun 2022 | $1.0M | $84.1K |
| May 2022 | $1.3M | $113K |
| Apr 2022 | $1.3M | $111K |
| Mar 2022 | $985K | $82.7K |
| Feb 2022 | $1.1M | $88.4K |
| Jan 2022 | $1.7M | $145K |
| Dec 2021 | $772K | $64.9K |
| Nov 2021 | $1.5M | $128K |
| Oct 2021 | $1.8M | $148K |
| Sep 2021 | $1.6M | $134K |
| Aug 2021 | $934K | $78.5K |
| Jul 2021 | $1.1M | $95.2K |
| Jun 2021 | $1.3M | $113K |
| May 2021 | $1.3M | $108K |
| Apr 2021 | $1.5M | $126K |
| Mar 2021 | $912K | $76.6K |
| Feb 2021 | $1.1M | $89.6K |
| Jan 2021 | $2.4M | $198K |
| Dec 2020 | $2.0M | $167K |
| Nov 2020 | $2.3M | $196K |
| Oct 2020 | $2.3M | $193K |
| Sep 2020 | $3.0M | $255K |
| Aug 2020 | $2.3M | $191K |
| Jul 2020 | $887K | $74.5K |
| Jun 2020 | $492K | $41.3K |
| May 2020 | $340K | $28.5K |
| Apr 2020 | $186K | $15.6K |
| Mar 2020 | $478K | $40.1K |
| Feb 2020 | $992K | $83.3K |
| Jan 2020 | $1.6M | $138K |
| Dec 2019 | $819K | $68.8K |
| Year | Revenue (AGR) | State tax |
|---|---|---|
| 2026 | $4.7M (8 mo) | $391K (8 mo) |
| 2025 | $9.9M | $828K |
| 2024 | $9.6M | $803K |
| 2023 | $21.8M | $1.8M |
| 2022 | $16.9M | $1.4M |
| 2021 | $16.2M | $1.4M |
| 2020 | $17.0M | $1.4M |
| 2019 | $819K (1 mo) | $68.8K (1 mo) |
Years with missing months show partial totals, marked with the number of months reported.
| Operator | GGR |
|---|---|
| DraftKings | $5.9M |
| FanDuel | $1.5M |
| Underdog Fantasy | $894K |
| FFPC | $261K |
| Splash Sports | $44.6K |
| RealTime Fantasy Sports | $42.1K |
| DataForce | $16.4K |
| FullTime (unmatched) | $0 |
| Bally's Corporation | $0 |
| Boom Fantasy | $0 |
| FastDraft | $0 |
| PrizePicks | $0 |
| SportsHub Regulatory | $0 |
| Win It All | $0 |
| Yahoo Fantasy Sports | $0 |
| OwnersBox | −$1,726 |
License-holder totals may include partner-operated brands. “(unmatched)” rows show the regulator's reported name with no linked operator record here — that can be an operator not yet matched, or a non-operator reporting channel (e.g. a lottery's own retail-location sales) rather than a licensed sportsbook or casino.
Notes
Adjusted revenue is fantasy contest adjusted revenue, the taxable base. Tax paid is state fantasy contest tax (8.4% of adjusted revenue).
Sources
- MGCB Dfs Revenue 2021 (FantasyContests-Sept-2022-all-vendors.xlsx)
- MGCB Dfs Revenue 2022 (Fantasy_Contests-April_2023-Excel.xlsx)
- MGCB Dfs Revenue 2023 (Fantasy_Contests_Revenue-2024-XLS.xlsx)
- MGCB Dfs Revenue 2024 (Fantasy_Contests_Revenue-2025-XLS.xlsx)
- MGCB Dfs Revenue 2025 (Fantasy_Contests_Revenue-2026-XLS.xlsx)
- MGCB Dfs Revenue 2026 (Fantasy_Contests_Revenue-2026-XLS.xlsx)
Related charts
Same chart for other states
Arizona · Connecticut · Iowa · Louisiana · Maine · Massachusetts · Pennsylvania