Louisiana Daily Fantasy Sports Revenue and Handle by Month
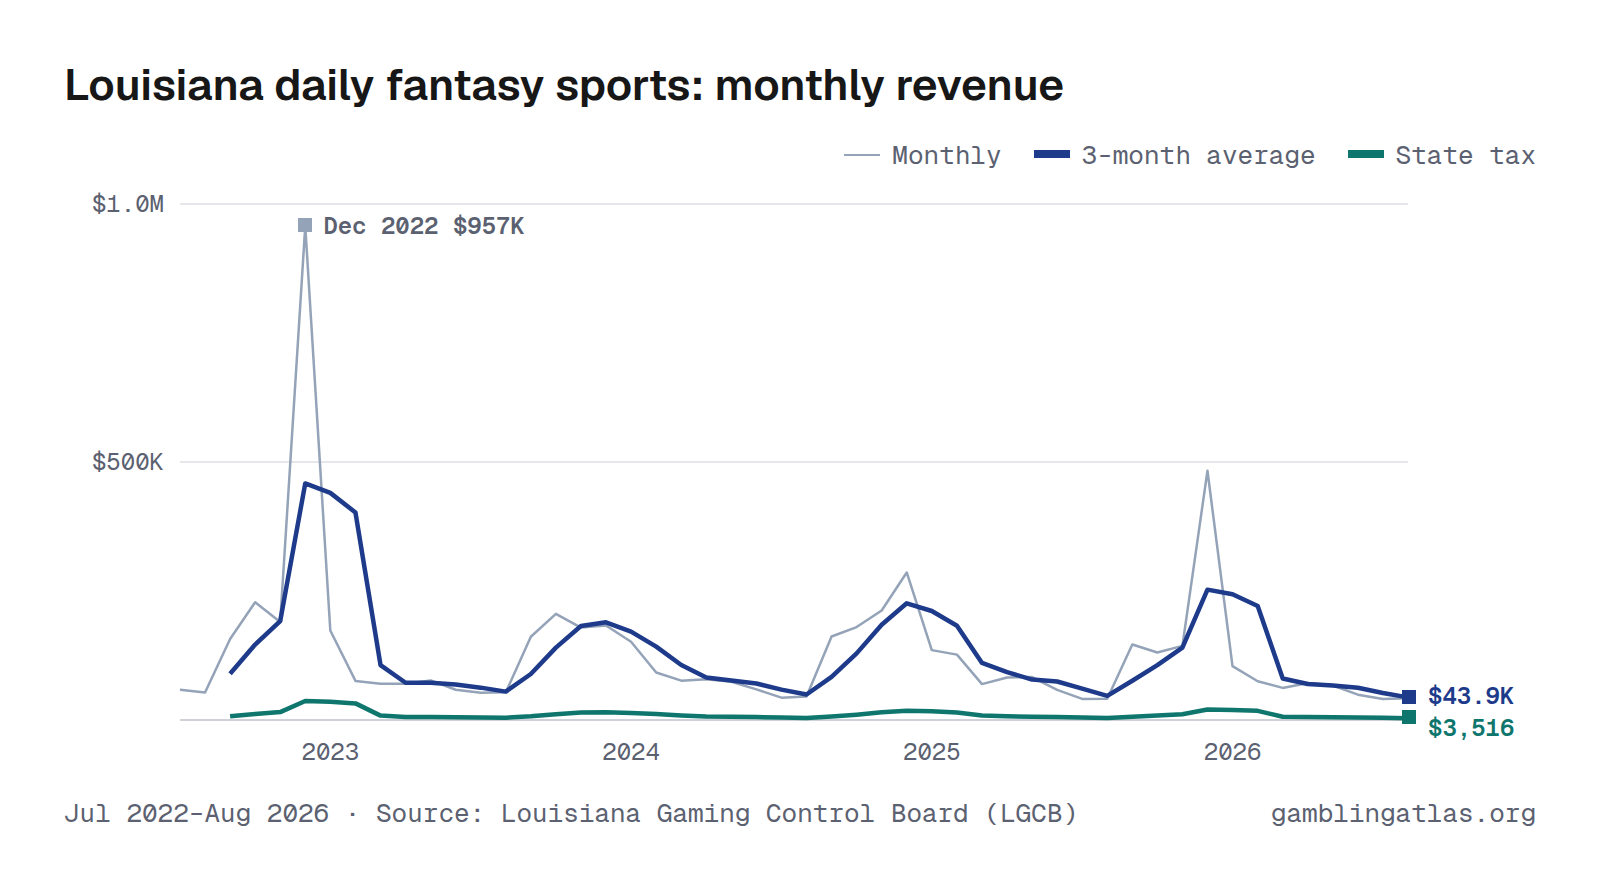
Louisiana daily fantasy sports produced $42.0K in adjusted gross revenue in August 2026, up 2% from Aug 2025. Over the 12 months through Aug 2026, revenue totaled $1.4M on $12.8M in bets, and the state collected $113K in tax. In the shared comparison window Aug 2025–Jul 2026, it ranked 7th largest of 8 states with monthly daily fantasy sports revenue.
The highest month on record here is Dec 2022 ($957K). Monthly figures run from Jul 2022 to Aug 2026 and come from the Louisiana Gaming Control Board (LGCB).
Jul 2022–Aug 2026 · Source: Louisiana Gaming Control Board (LGCB) · Louisiana revenue
Handle (amount bet)
Download, embed or cite
Free to reuse with a link to this page. License and sources
Data
| Month | Handle | Revenue (AGR) | State tax |
|---|---|---|---|
| Aug 2026 | $354K | $42.0K | $3,357 |
| Jul 2026 | $350K | $40.8K | $3,261 |
| Jun 2026 | $437K | $49.1K | $3,930 |
| May 2026 | $558K | $66.8K | $5,342 |
| Apr 2026 | $617K | $71.8K | $5,745 |
| Mar 2026 | $508K | $62.2K | $4,975 |
| Feb 2026 | $634K | $75.0K | $6,004 |
| Jan 2026 | $867K | $104K | $8,340 |
| Dec 2025 | $4.8M | $483K | $38.6K |
| Nov 2025 | $1.2M | $144K | $11.5K |
| Oct 2025 | $1.2M | $131K | $10.5K |
| Sep 2025 | $1.3M | $146K | $11.7K |
| Aug 2025 | $372K | $41.2K | $3,295 |
| Jul 2025 | $367K | $40.8K | $3,264 |
| Jun 2025 | $496K | $58.3K | $4,668 |
| May 2025 | $672K | $83.1K | $6,650 |
| Apr 2025 | $690K | $82.5K | $6,597 |
| Mar 2025 | $590K | $69.6K | $5,571 |
| Feb 2025 | $1.0M | $127K | $10.1K |
| Jan 2025 | $1.1M | $135K | $10.8K |
| Dec 2024 | $2.4M | $286K | $22.9K |
| Nov 2024 | $1.8M | $212K | $17.0K |
| Oct 2024 | $1.6M | $180K | $14.4K |
| Sep 2024 | $1.5M | $162K | $12.9K |
| Aug 2024 | $436K | $45.5K | $3,636 |
| Jul 2024 | $406K | $43.3K | $3,460 |
| Jun 2024 | $564K | $59.3K | $4,748 |
| May 2024 | $687K | $74.1K | $5,929 |
| Apr 2024 | $776K | $78.9K | $6,313 |
| Mar 2024 | $765K | $76.2K | $6,094 |
| Feb 2024 | $731K | $92.1K | $7,372 |
| Jan 2024 | $1.5M | $152K | $12.1K |
| Dec 2023 | $1.7M | $183K | $14.6K |
| Nov 2023 | $1.6M | $179K | $14.3K |
| Oct 2023 | $1.9M | $206K | $16.5K |
| Sep 2023 | $1.5M | $161K | $12.9K |
| Aug 2023 | $532K | $53.6K | $4,286 |
| Jul 2023 | $512K | $52.8K | $4,222 |
| Jun 2023 | $560K | $58.7K | $4,698 |
| May 2023 | $721K | $76.7K | $6,138 |
| Apr 2023 | $688K | $70.4K | $5,634 |
| Mar 2023 | $675K | $70.2K | $5,615 |
| Feb 2023 | $724K | $75.8K | $6,068 |
| Jan 2023 | $1.6M | $173K | $13.9K |
| Dec 2022 | $9.5M | $957K | $76.6K |
| Nov 2022 | $1.7M | $190K | $15.2K |
| Oct 2022 | $2.1M | $228K | $18.3K |
| Sep 2022 | $1.5M | $157K | $12.6K |
| Aug 2022 | $547K | $53.4K | $4,275 |
| Jul 2022 | $559K | $58.4K | $4,669 |
| Year | Handle | Revenue (AGR) | State tax |
|---|---|---|---|
| 2026 | $4.3M (8 mo) | $512K (8 mo) | $41.0K (8 mo) |
| 2025 | $13.7M | $1.5M | $123K |
| 2024 | $13.0M | $1.5M | $117K |
| 2023 | $12.8M | $1.4M | $109K |
| 2022 | $16.0M (6 mo) | $1.6M (6 mo) | $132K (6 mo) |
Years with missing months show partial totals, marked with the number of months reported.
Notes
Adjusted revenue is the report's "Net Revenue" column (entry fees less prizes paid), the base for the 8% statutory privilege tax. Tax paid is the report's "Taxes Paid" column. The report prints one statewide total row per month (no per-operator breakout); "Gross FS Contest Revenues" (total entry fees before prizes paid) is recorded as handle. The source workbook's own date column on the current fiscal-year tab is mislabeled one year too early; this parser derives each row's calendar month from its position within the tab instead.
Sources
Related charts
Same chart for other states
Arizona · Connecticut · Iowa · Maine · Massachusetts · Michigan · Pennsylvania