Michigan Sportsbook Market Share: FanDuel, DraftKings and Others
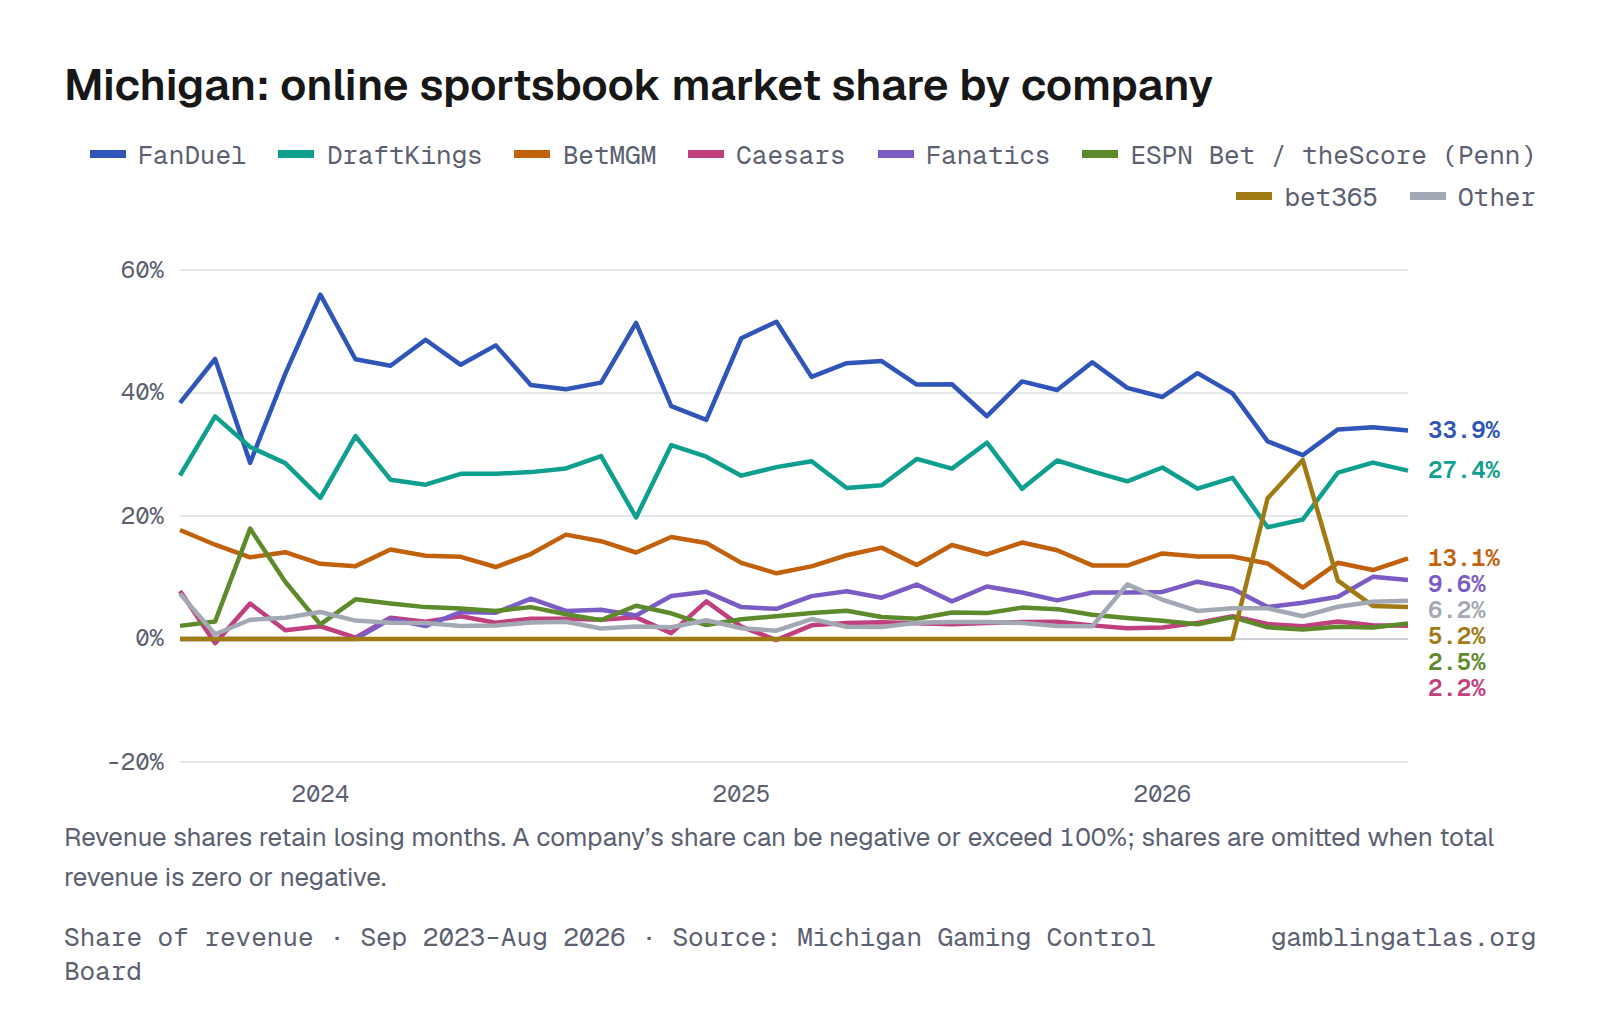
FanDuel had 38% of Michigan's online sportsbook revenue over the 12 months through Aug 2026, followed by DraftKings at 25% and BetMGM at 12%. FanDuel and DraftKings together took 63%.
In August 2026 alone, FanDuel had 34%, DraftKings had 27%, BetMGM had 13%. Shares come from the state's reports by sportsbook brand, Jan 2021 to Aug 2026.
Share of revenue · Sep 2023–Aug 2026 · Source: Michigan Gaming Control Board · Sportsbook market share
Download, embed or cite
Free to reuse with a link to this page. License and sources
Data
| Month | FanDuel | DraftKings | BetMGM | Caesars | Fanatics | ESPN Bet / theScore (Penn) | bet365 | Other | Total |
|---|---|---|---|---|---|---|---|---|---|
| Aug 2026 | 33.9% | 27.4% | 13.1% | 2.2% | 9.6% | 2.5% | 5.2% | 6.2% | $34.6M |
| Jul 2026 | 34.4% | 28.7% | 11.2% | 2.2% | 10.1% | 1.9% | 5.4% | 6.1% | $43.4M |
| Jun 2026 | 34.1% | 27.1% | 12.4% | 2.9% | 6.9% | 2.0% | 9.5% | 5.2% | $40.1M |
| May 2026 | 29.9% | 19.4% | 8.4% | 2.1% | 5.9% | 1.6% | 29.1% | 3.7% | $76.7M |
| Apr 2026 | 32.1% | 18.2% | 12.3% | 2.4% | 5.2% | 1.9% | 22.9% | 5.0% | $67.6M |
| Mar 2026 | 39.9% | 26.2% | 13.4% | 3.7% | 8.2% | 3.5% | 5.0% | $50.0M | |
| Feb 2026 | 43.2% | 24.4% | 13.4% | 2.6% | 9.3% | 2.4% | 4.6% | $39.9M | |
| Jan 2026 | 39.4% | 27.9% | 13.9% | 1.9% | 7.6% | 2.9% | 6.4% | $58.0M | |
| Dec 2025 | 40.8% | 25.6% | 11.9% | 1.7% | 7.5% | 3.4% | 8.9% | $84.0M | |
| Nov 2025 | 45.0% | 27.3% | 12.0% | 2.2% | 7.6% | 3.9% | 2.1% | $87.3M | |
| Oct 2025 | 40.5% | 29.0% | 14.4% | 2.8% | 6.3% | 4.9% | 2.1% | $73.8M | |
| Sep 2025 | 41.9% | 24.4% | 15.7% | 2.8% | 7.6% | 5.1% | 2.6% | $43.6M | |
| Aug 2025 | 36.2% | 31.9% | 13.7% | 2.6% | 8.5% | 4.2% | 2.8% | $49.3M | |
| Jul 2025 | 41.4% | 27.7% | 15.3% | 2.4% | 6.1% | 4.3% | 2.8% | $34.1M | |
| Jun 2025 | 41.4% | 29.3% | 12.0% | 2.6% | 8.9% | 3.3% | 2.6% | $44.6M | |
| May 2025 | 45.2% | 25.0% | 14.9% | 2.7% | 6.7% | 3.6% | 2.0% | $50.0M | |
| Apr 2025 | 44.9% | 24.6% | 13.6% | 2.6% | 7.8% | 4.6% | 2.0% | $42.6M | |
| Mar 2025 | 42.6% | 28.9% | 11.8% | 2.2% | 7.0% | 4.2% | 3.2% | $33.0M | |
| Feb 2025 | 51.6% | 27.9% | 10.7% | -0.2% | 4.9% | 3.7% | 1.3% | $46.0M | |
| Jan 2025 | 48.9% | 26.6% | 12.4% | 2.0% | 5.2% | 3.2% | 1.7% | $83.0M | |
| Dec 2024 | 35.6% | 29.6% | 15.6% | 6.1% | 7.7% | 2.3% | 3.1% | $20.2M | |
| Nov 2024 | 37.9% | 31.5% | 16.6% | 0.9% | 7.0% | 4.2% | 1.9% | $58.3M | |
| Oct 2024 | 51.4% | 19.8% | 14.1% | 3.5% | 3.8% | 5.4% | 2.0% | $33.0M | |
| Sep 2024 | 41.7% | 29.7% | 15.9% | 3.1% | 4.7% | 3.1% | 1.7% | $58.4M | |
| Aug 2024 | 40.6% | 27.7% | 17.0% | 3.3% | 4.6% | 4.0% | 2.8% | $27.4M | |
| Jul 2024 | 41.3% | 27.1% | 13.8% | 3.3% | 6.6% | 5.2% | 2.7% | $29.4M | |
| Jun 2024 | 47.7% | 26.9% | 11.7% | 2.6% | 4.3% | 4.6% | 2.2% | $30.9M | |
| May 2024 | 44.6% | 26.9% | 13.4% | 3.7% | 4.4% | 5.0% | 2.1% | $40.9M | |
| Apr 2024 | 48.7% | 25.1% | 13.5% | 2.8% | 2.1% | 5.2% | 2.6% | $41.9M | |
| Mar 2024 | 44.4% | 25.9% | 14.6% | 3.5% | 3.2% | 5.8% | 2.7% | $41.9M | |
| Feb 2024 | 45.5% | 33.0% | 11.8% | 0.2% | 6.5% | 3.0% | $30.5M | ||
| Jan 2024 | 56.0% | 23.0% | 12.2% | 2.1% | 2.4% | 4.4% | $47.7M | ||
| Dec 2023 | 43.1% | 28.6% | 14.1% | 1.4% | 9.3% | 3.5% | $61.1M | ||
| Nov 2023 | 28.6% | 31.2% | 13.3% | 5.8% | 18.0% | 3.1% | $33.9M | ||
| Oct 2023 | 45.5% | 36.2% | 15.3% | -0.7% | 2.9% | 0.8% | $45.0M | ||
| Sep 2023 | 38.4% | 26.6% | 17.7% | 7.8% | 2.1% | 7.4% | $44.0M | ||
| Aug 2023 | 40.5% | 24.1% | 15.8% | 8.4% | 3.9% | 7.2% | $23.2M | ||
| Jul 2023 | 40.1% | 24.7% | 18.3% | 3.3% | 4.5% | 9.1% | $22.5M | ||
| Jun 2023 | 55.6% | 11.5% | 16.0% | 4.9% | 4.0% | 8.1% | $18.3M | ||
| May 2023 | 49.9% | 22.3% | 18.0% | 0.3% | 3.7% | 5.8% | $35.2M | ||
| Apr 2023 | 47.8% | 25.3% | 17.5% | 2.3% | 1.2% | 5.8% | $36.3M | ||
| Mar 2023 | 45.0% | 19.8% | 21.8% | 3.6% | 4.2% | 5.6% | $44.6M | ||
| Feb 2023 | 61.4% | 14.3% | 13.8% | 5.1% | 0.5% | 4.9% | $22.7M | ||
| Jan 2023 | 59.2% | 19.7% | 10.1% | 5.7% | -0.2% | 5.5% | $33.6M | ||
| Dec 2022 | 43.3% | 18.2% | 23.2% | 6.7% | 2.8% | 5.8% | $48.8M | ||
| Nov 2022 | 48.9% | 16.4% | 21.0% | 5.4% | 3.0% | 5.4% | $40.8M | ||
| Oct 2022 | 42.4% | 20.1% | 20.2% | 6.0% | 7.0% | 4.3% | $49.2M | ||
| Sep 2022 | 39.7% | 22.0% | 20.5% | 5.0% | 6.9% | 5.9% | $47.8M | ||
| Aug 2022 | 32.1% | 26.2% | 21.2% | 7.0% | 4.6% | 8.9% | $24.0M | ||
| Jul 2022 | 35.8% | 21.5% | 25.7% | 5.3% | 5.8% | 5.8% | $21.6M | ||
| Jun 2022 | 39.1% | 11.1% | 32.2% | -1.9% | 10.8% | 8.6% | $15.4M | ||
| May 2022 | 45.2% | 15.0% | 26.2% | 2.1% | 5.6% | 5.9% | $33.5M | ||
| Apr 2022 | 50.8% | 12.5% | 23.7% | 3.8% | 3.7% | 5.5% | $30.7M | ||
| Mar 2022 | 43.4% | 10.9% | 30.5% | 6.7% | 1.4% | 7.1% | $30.5M | ||
| Feb 2022 | 21.3% | 17.8% | 26.5% | 7.5% | 20.0% | 6.9% | $22.5M | ||
| Jan 2022 | 35.4% | 17.1% | 31.4% | 3.3% | 7.9% | 4.8% | $34.7M | ||
| Dec 2021 | 27.7% | 21.1% | 27.0% | 7.5% | 7.6% | 9.2% | $34.8M | ||
| Nov 2021 | 33.9% | 24.2% | 23.4% | 6.4% | 5.5% | 6.5% | $54.1M | ||
| Oct 2021 | 42.5% | 12.0% | 30.8% | 4.3% | 3.5% | 6.9% | $24.3M | ||
| Sep 2021 | 30.3% | 12.8% | 37.1% | 2.5% | 6.9% | 10.4% | $23.7M | ||
| Aug 2021 | 30.3% | 27.6% | 24.3% | 1.0% | 4.7% | 12.1% | $15.9M | ||
| Jul 2021 | 40.0% | 15.8% | 25.4% | 1.3% | 7.3% | 10.2% | $19.6M | ||
| Jun 2021 | 41.1% | 19.9% | 24.6% | 2.4% | 7.3% | 4.7% | $24.9M | ||
| May 2021 | 47.8% | 9.8% | 27.0% | 1.1% | 5.7% | 8.6% | $19.5M | ||
| Apr 2021 | 34.5% | 16.6% | 27.0% | 1.7% | 11.8% | 8.3% | $20.4M | ||
| Mar 2021 | 24.1% | 18.7% | 27.0% | 3.2% | 14.5% | 12.5% | $32.3M | ||
| Feb 2021 | -0.8% | -1.7% | 56.1% | 4.7% | 20.0% | 21.7% | $9.5M | ||
| Jan 2021 | 4.7% | 25.3% | 38.2% | 0.9% | 25.0% | 5.9% | $13.3M |
Notes
Where the state reports by license holder, results are assigned to the sportsbook brand operating on that license.
Revenue shares retain losing months. A company’s share can be negative or exceed 100%; shares are omitted when total revenue is zero or negative.
Sources
Related charts
Same chart for other states
Arizona · Connecticut · District of Columbia · Indiana · Maine · Maryland · Massachusetts · New York · Ohio · Pennsylvania · Wyoming