States / District of Columbia / Chart
District of Columbia Sportsbook Market Share: FanDuel, DraftKings and Others
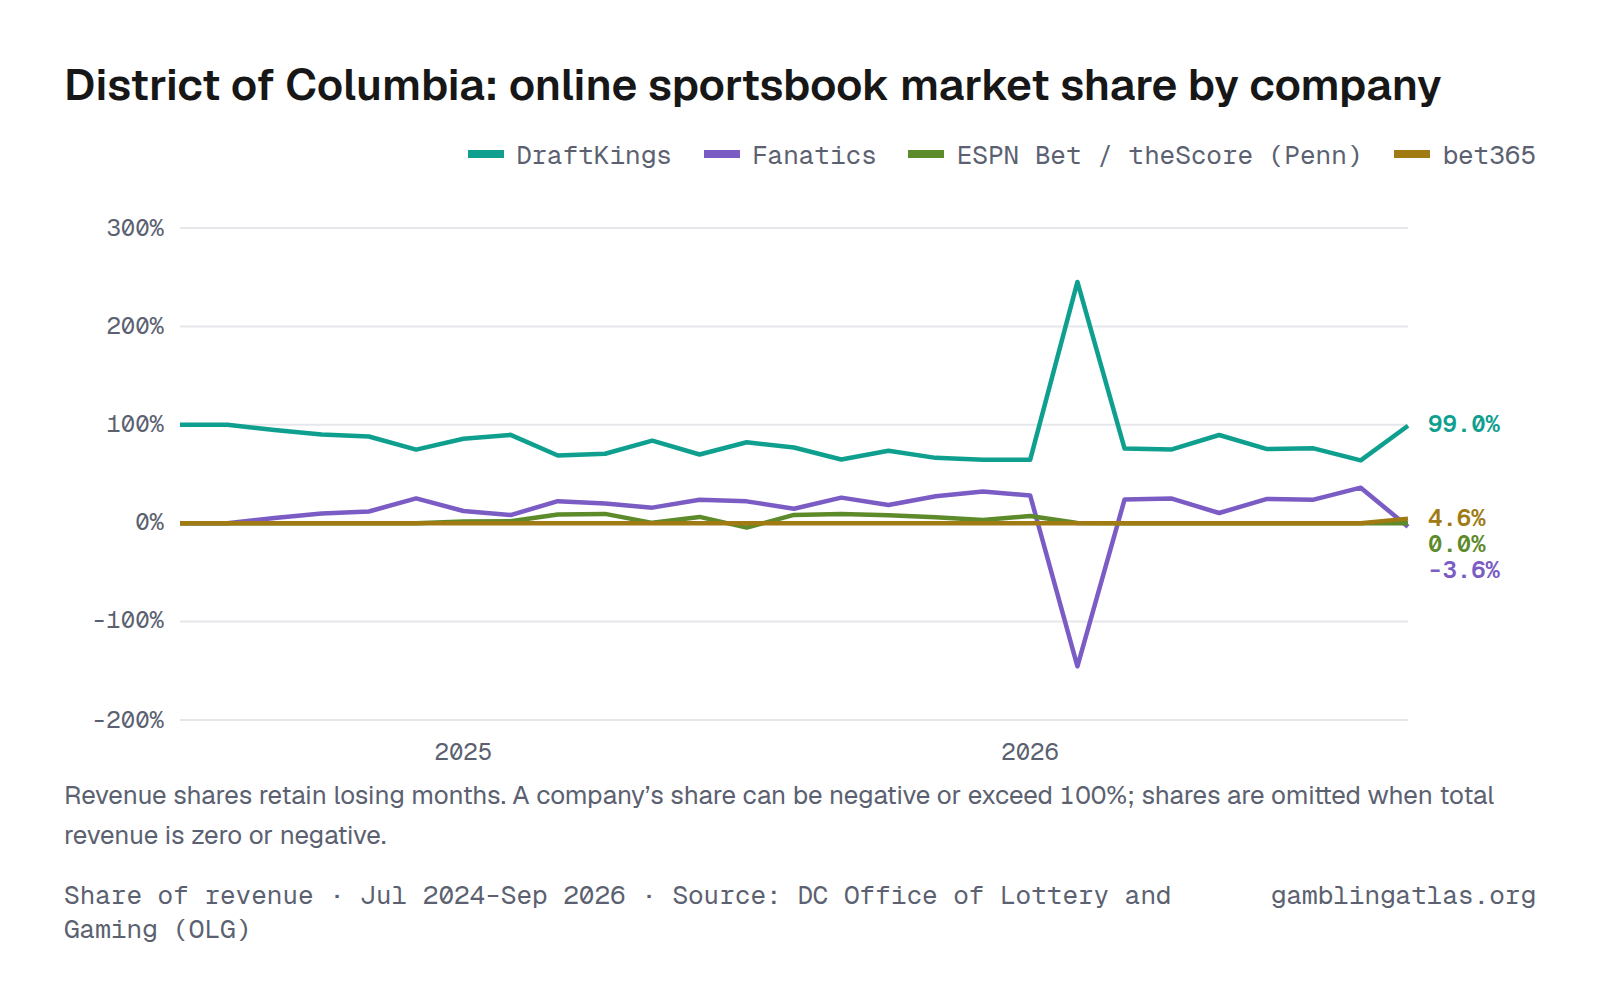
DraftKings had 77% of District of Columbia's online sportsbook revenue over the 12 months through Sep 2026, followed by Fanatics at 20% and ESPN Bet / theScore (Penn) at 3%. FanDuel and DraftKings together took 77%.
In September 2026 alone, DraftKings had 99%, Fanatics had -4%, ESPN Bet / theScore (Penn) had 0%. Shares come from the state's reports by sportsbook brand, Jul 2024 to Sep 2026.
Share of revenue · Jul 2024–Sep 2026 · Source: DC Office of Lottery and Gaming (OLG) · Sportsbook market share
Download, embed or cite
Free to reuse with a link to this page. License and sources
Data
| Month | DraftKings | Fanatics | ESPN Bet / theScore (Penn) | bet365 | Total |
|---|---|---|---|---|---|
| Sep 2026 | 99.0% | -3.6% | 4.6% | $1.3M | |
| Aug 2026 | 63.9% | 36.1% | $2.0M | ||
| Jul 2026 | 76.1% | 23.9% | $2.3M | ||
| Jun 2026 | 75.5% | 24.5% | $2.5M | ||
| May 2026 | 89.6% | 10.4% | $2.5M | ||
| Apr 2026 | 75.0% | 25.0% | $3.7M | ||
| Mar 2026 | 75.9% | 24.1% | $2.9M | ||
| Feb 2026 | 245.2% | -145.4% | 0.2% | $764K | |
| Jan 2026 | 64.4% | 28.3% | 7.3% | $3.2M | |
| Dec 2025 | 64.4% | 32.2% | 3.3% | $3.7M | |
| Nov 2025 | 66.4% | 27.5% | 6.1% | $4.7M | |
| Oct 2025 | 73.6% | 18.4% | 8.0% | $3.0M | |
| Sep 2025 | 64.7% | 26.0% | 9.3% | $2.2M | |
| Aug 2025 | 76.9% | 14.7% | 8.5% | $2.0M | |
| Jul 2025 | 82.3% | 22.2% | -4.5% | $1.5M | |
| Jun 2025 | 69.8% | 23.8% | 6.4% | $2.2M | |
| May 2025 | 83.8% | 15.8% | 0.3% | $2.7M | |
| Apr 2025 | 70.6% | 19.9% | 9.4% | $2.6M | |
| Mar 2025 | 68.8% | 22.4% | 8.8% | $2.5M | |
| Feb 2025 | 89.8% | 8.2% | 1.9% | $2.2M | |
| Jan 2025 | 85.9% | 12.4% | 1.8% | $2.3M | |
| Dec 2024 | 74.8% | 25.2% | $916K | ||
| Nov 2024 | 88.1% | 11.9% | $2.5M | ||
| Oct 2024 | 90.0% | 10.0% | $1.6M | ||
| Sep 2024 | 94.6% | 5.4% | $2.2M | ||
| Aug 2024 | 100.0% | $875K | |||
| Jul 2024 | 100.0% | $113K |
Notes
Revenue shares retain losing months. A company’s share can be negative or exceed 100%; shares are omitted when total revenue is zero or negative.
Sources
Related charts
Same chart for other states
Arizona · Connecticut · Indiana · Maine · Maryland · Massachusetts · Michigan · New York · Ohio · Pennsylvania · Wyoming