Charts / Chart
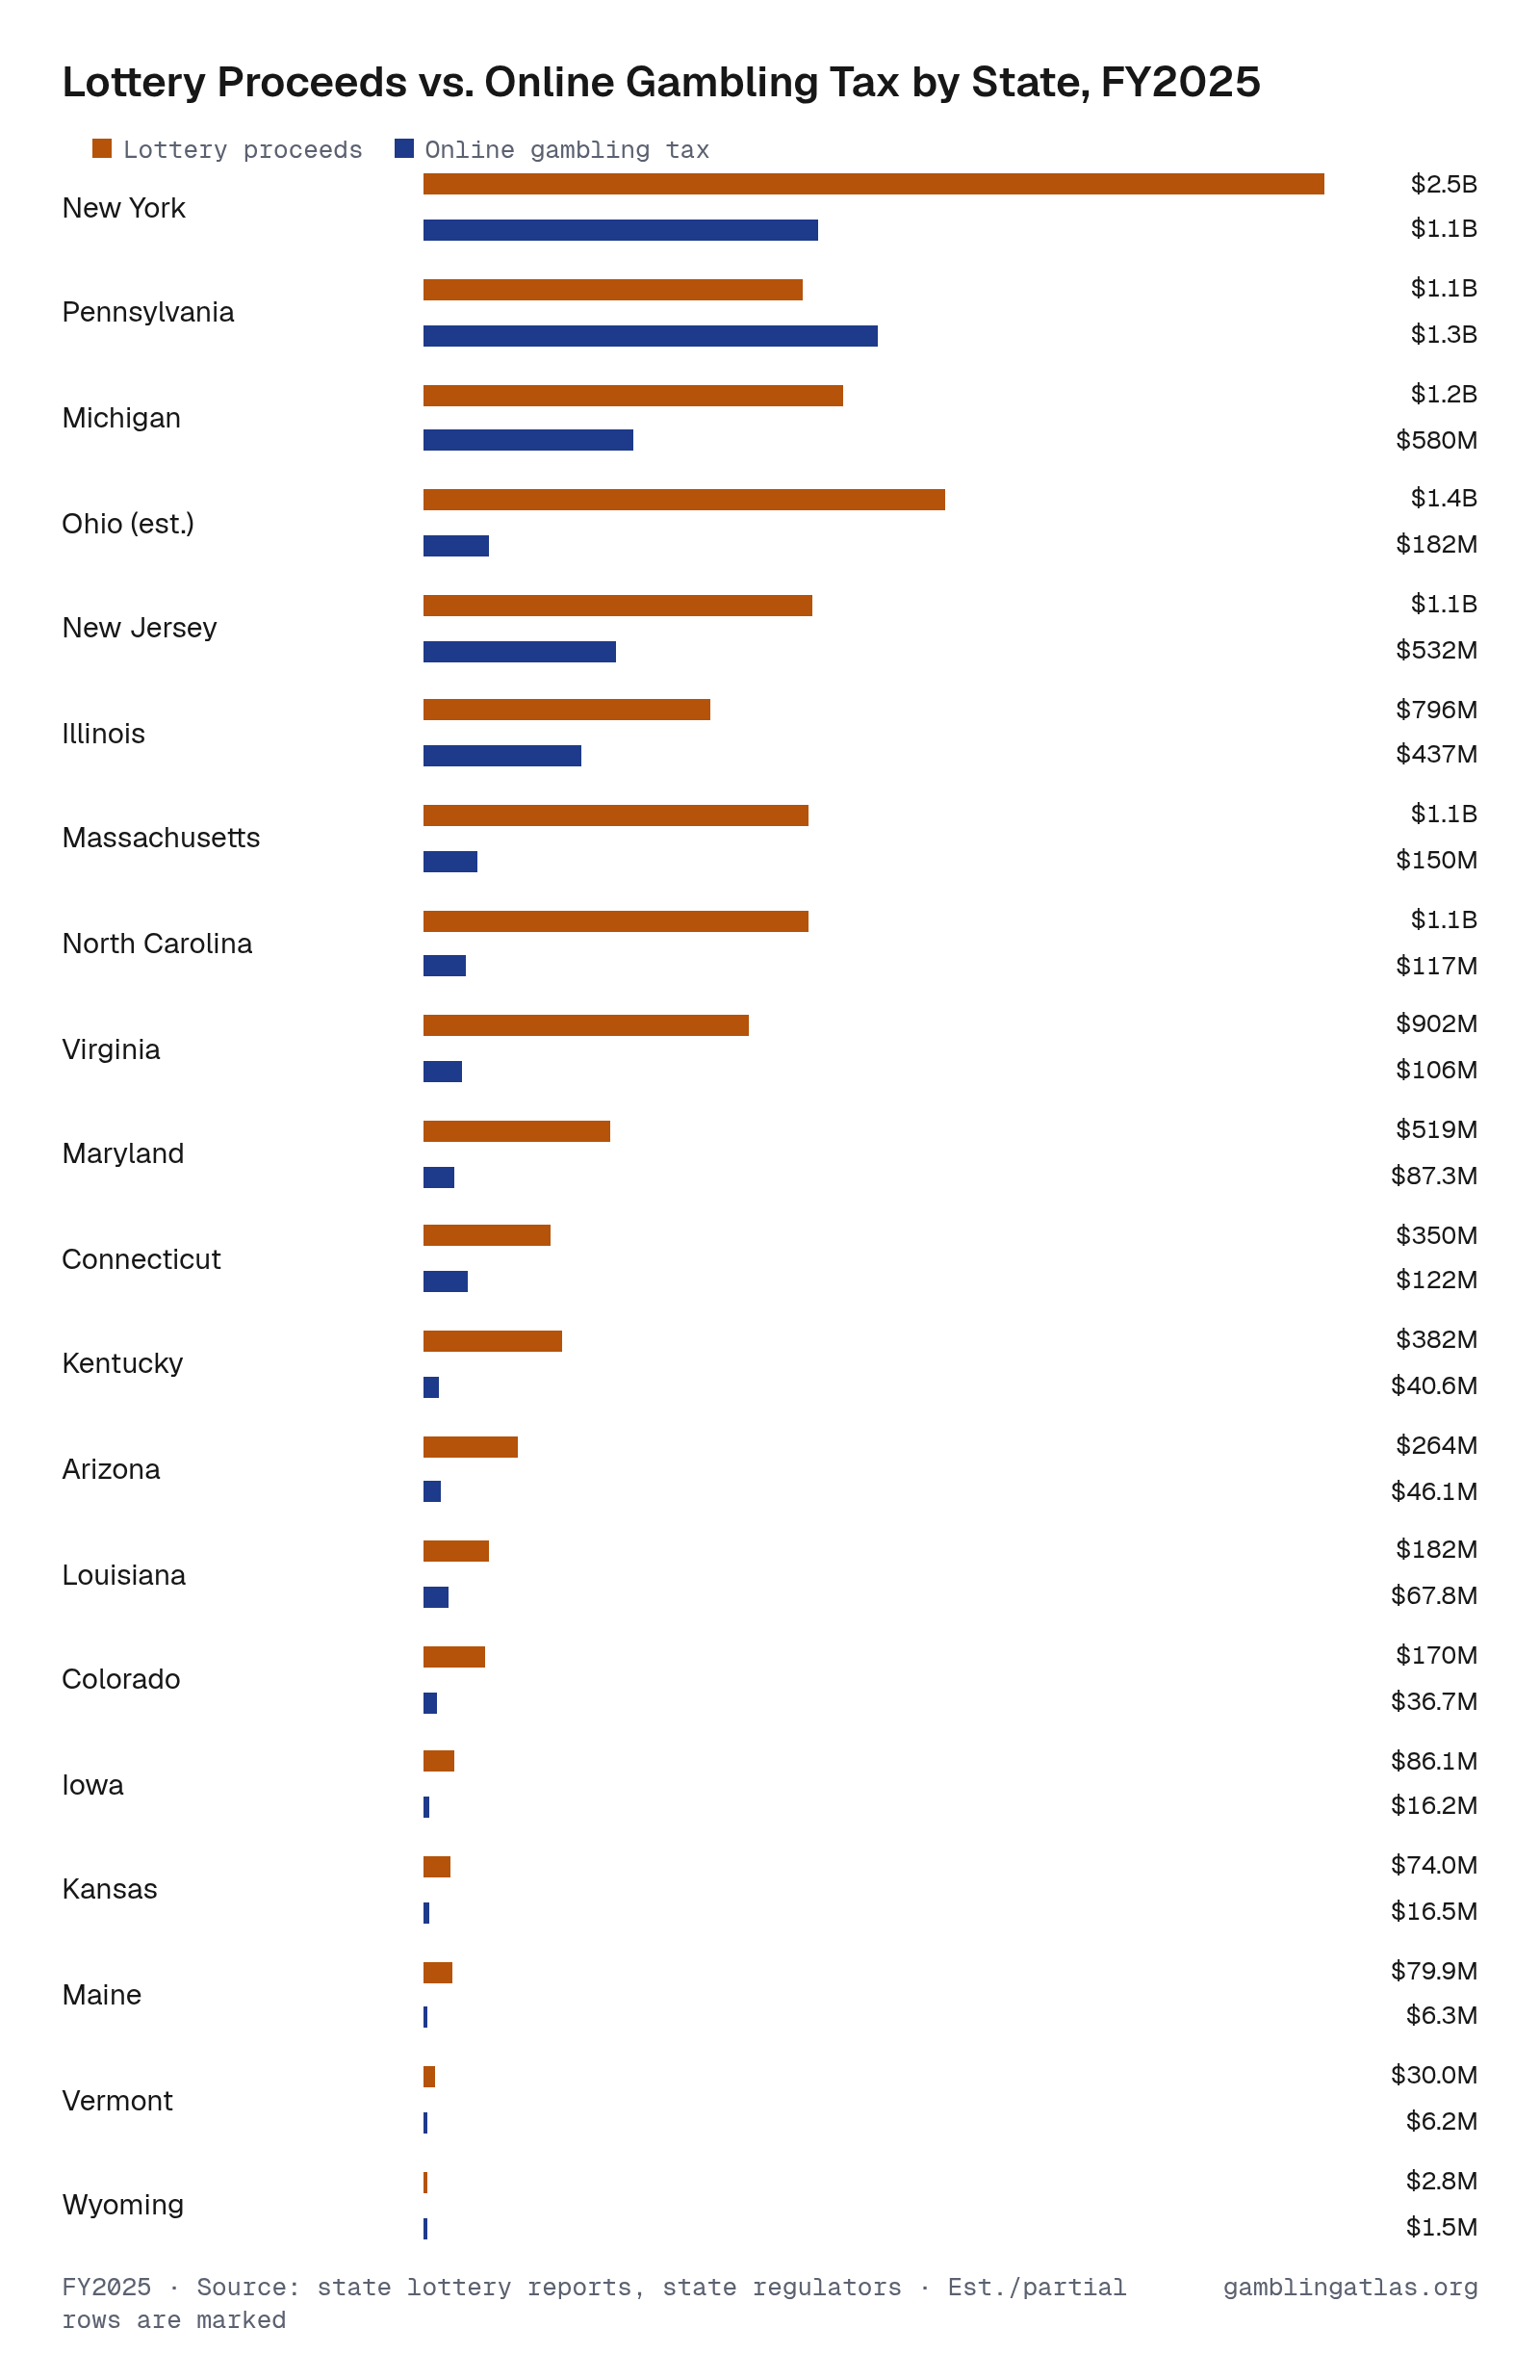
Lottery Proceeds vs. Online Gambling Tax by State, FY2025
Across the 20 states with live online sports betting or online casinos and a FY2025 lottery report, lotteries transferred $13.2B to their states and online gambling taxes brought in $4.90B.
Online gambling tax exceeded lottery proceeds in Pennsylvania.
FY2025 · Source: state lottery reports, state regulators · Est./partial rows are marked · Lottery
Download, embed or cite
Free to reuse with a link to this page. License and sources
Data
| State | Lottery proceeds | Online sportsbook tax | Online casino tax | Online total | Period |
|---|---|---|---|---|---|
| New York | $2.50B | $1.09B | $1.09B | Apr 2024–Mar 2025 | |
| Pennsylvania | $1.05B | $165M | $1.10B | $1.26B | Jul 2024–Jun 2025 |
| Michigan | $1.16B | $17.7M | $562M | $580M | Oct 2024–Sep 2025 |
| Ohio (est.) | $1.45B | $182M | $182M | Jul 2024–Jun 2025 | |
| New Jersey | $1.08B | $136M | $396M | $532M | Jul 2024–Jun 2025 |
| Illinois | $796M | $437M | $437M | Jul 2024–Jun 2025 | |
| Massachusetts | $1.07B | $150M | $150M | Jul 2024–Jun 2025 | |
| North Carolina | $1.07B | $117M | $117M | Jul 2024–Jun 2025 | |
| Virginia | $902M | $106M | $106M | Jul 2024–Jun 2025 | |
| Maryland | $519M | $87.3M | $87.3M | Jul 2024–Jun 2025 | |
| Connecticut | $350M | $26.4M | $95.1M | $122M | Jul 2024–Jun 2025 |
| Kentucky | $382M | $40.6M | $40.6M | Jul 2024–Jun 2025 | |
| Arizona | $264M | $46.1M | $46.1M | Jul 2024–Jun 2025 | |
| Louisiana | $182M | $67.8M | $67.8M | Jul 2024–Jun 2025 | |
| Colorado | $170M | $36.7M | $36.7M | Jul 2024–Jun 2025 | |
| Iowa | $86.1M | $16.2M | $16.2M | Jul 2024–Jun 2025 | |
| Kansas | $74.0M | $16.5M | $16.5M | Jul 2024–Jun 2025 | |
| Maine | $79.9M | $6.3M | $6.3M | Jul 2024–Jun 2025 | |
| Vermont | $30.0M | $6.2M | $6.2M | Jul 2024–Jun 2025 | |
| Wyoming | $2.8M | $1.5M | $1.5M | Jul 2024–Jun 2025 |
Notes
Online tax is summed over the 12 months ending at each lottery's fiscal-year end. Rows marked est. contain a parser-derived tax estimate; rows marked partial are missing a reported month after launch.
Related charts
By state
Arizona · Arkansas · California · Colorado · Connecticut · Delaware · Florida · Georgia · Idaho · Illinois · Indiana · Iowa · Kansas · Kentucky · Louisiana · Maine · Maryland · Massachusetts · Michigan · Minnesota · Mississippi · Missouri · Montana · Nebraska · New Hampshire · New Jersey · New Mexico · New York · North Carolina · North Dakota · Ohio · Oklahoma · Oregon · Pennsylvania · Rhode Island · South Carolina · South Dakota · Tennessee · Texas · Vermont · Virginia · Washington · West Virginia · Wisconsin · Wyoming