Illinois Lottery Sales and Revenue by Year
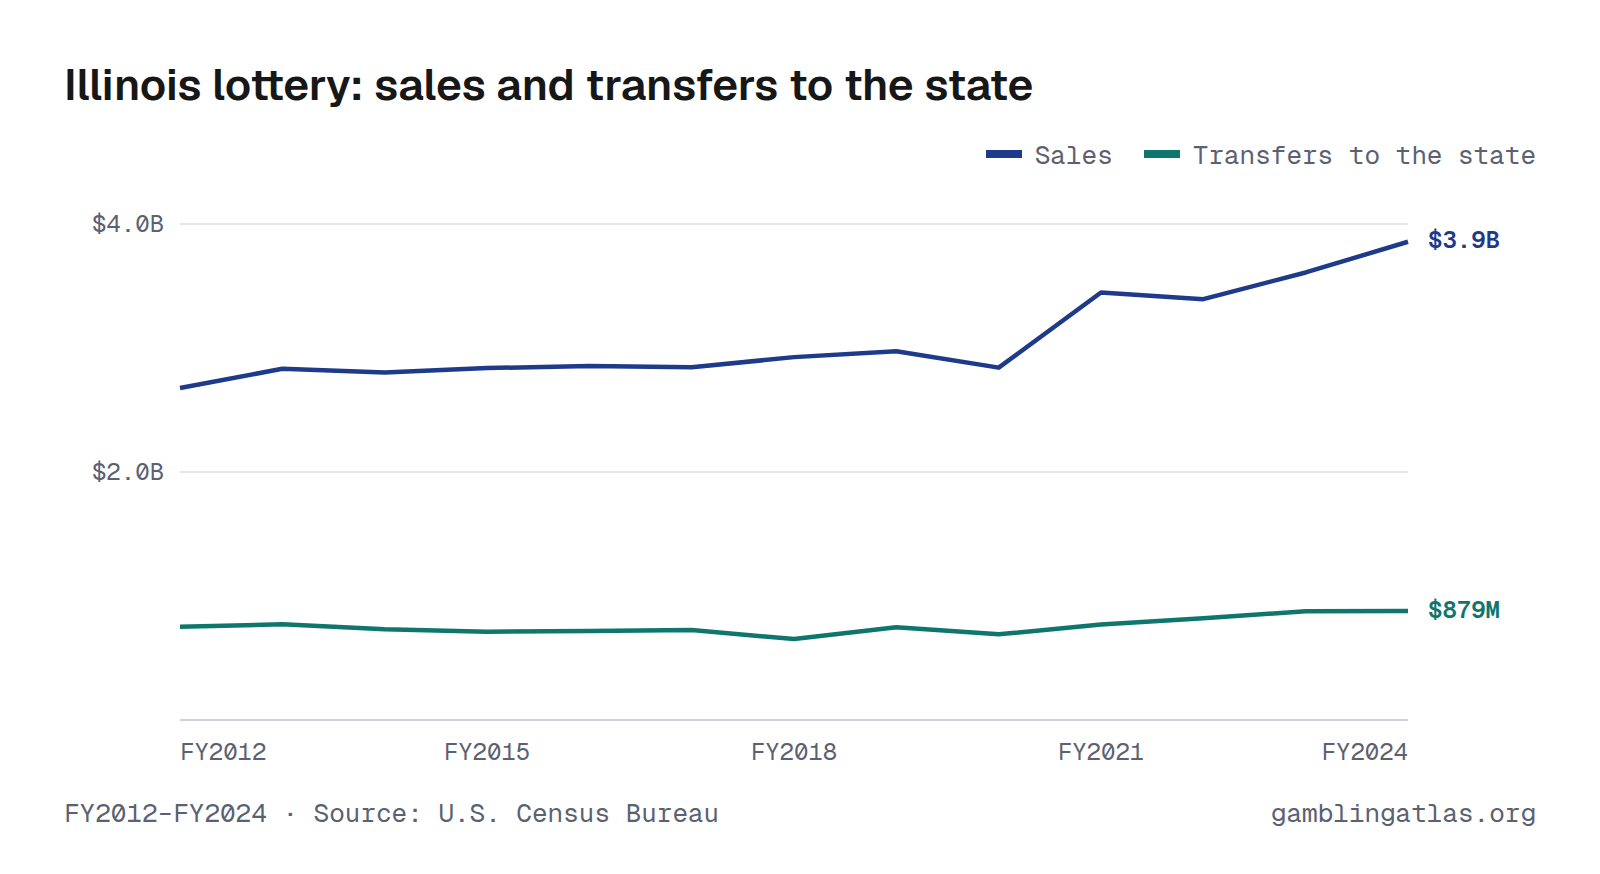
The Illinois lottery sold $3.86B in tickets in fiscal year 2024, up 7% from the year before. It transferred $879M to the state, 23% of sales, and paid 67% of sales back as prizes. Its sales were the 12th largest of the 45 state lotteries that year.
Sales peaked in FY2024 at $3.86B. Figures are state fiscal years from the Census Bureau's Annual Survey of State Government Finances, FY2012 to FY2024.
FY2012–FY2024 · Source: U.S. Census Bureau · Illinois lottery
Download, embed or cite
Free to reuse with a link to this page. License and sources
Data
| Fiscal year | Ticket sales | Prizes | Administration | Transfers to the state | Prizes as share of sales |
|---|---|---|---|---|---|
| FY2024 | $3.86B | $2.58B | $398M | $879M | 66.9% |
| FY2023 | $3.61B | $2.36B | $368M | $877M | 65.5% |
| FY2022 | $3.39B | $2.21B | $361M | $821M | 65.2% |
| FY2021 | $3.45B | $2.33B | $349M | $770M | 67.6% |
| FY2020 | $2.84B | $1.84B | $309M | $691M | 64.8% |
| FY2019 | $2.97B | $1.91B | $320M | $748M | 64.1% |
| FY2018 | $2.93B | $1.91B | $363M | $652M | 65.3% |
| FY2017 | $2.84B | $1.82B | $298M | $726M | 64.0% |
| FY2016 | $2.86B | $1.84B | $300M | $718M | 64.3% |
| FY2015 | $2.84B | $1.82B | $309M | $712M | 64.0% |
| FY2014 | $2.80B | $1.76B | $316M | $731M | 62.6% |
| FY2013 | $2.83B | $1.74B | $318M | $771M | 61.6% |
| FY2012 | $2.68B | $1.62B | $304M | $753M | 60.5% |
Notes
Transfers to the state are lottery proceeds the Census Bureau counts as income to the state; some states route part of them to dedicated funds.
Sources
Related charts
Same chart for other states
Arizona · Arkansas · California · Colorado · Connecticut · Delaware · Florida · Georgia · Idaho · Indiana · Iowa · Kansas · Kentucky · Louisiana · Maine · Maryland · Massachusetts · Michigan · Minnesota · Mississippi · Missouri · Montana · Nebraska · New Hampshire · New Jersey · New Mexico · New York · North Carolina · North Dakota · Ohio · Oklahoma · Oregon · Pennsylvania · Rhode Island · South Carolina · South Dakota · Tennessee · Texas · Vermont · Virginia · Washington · West Virginia · Wisconsin · Wyoming