Kentucky Historical Horse Racing Revenue and Handle by Month
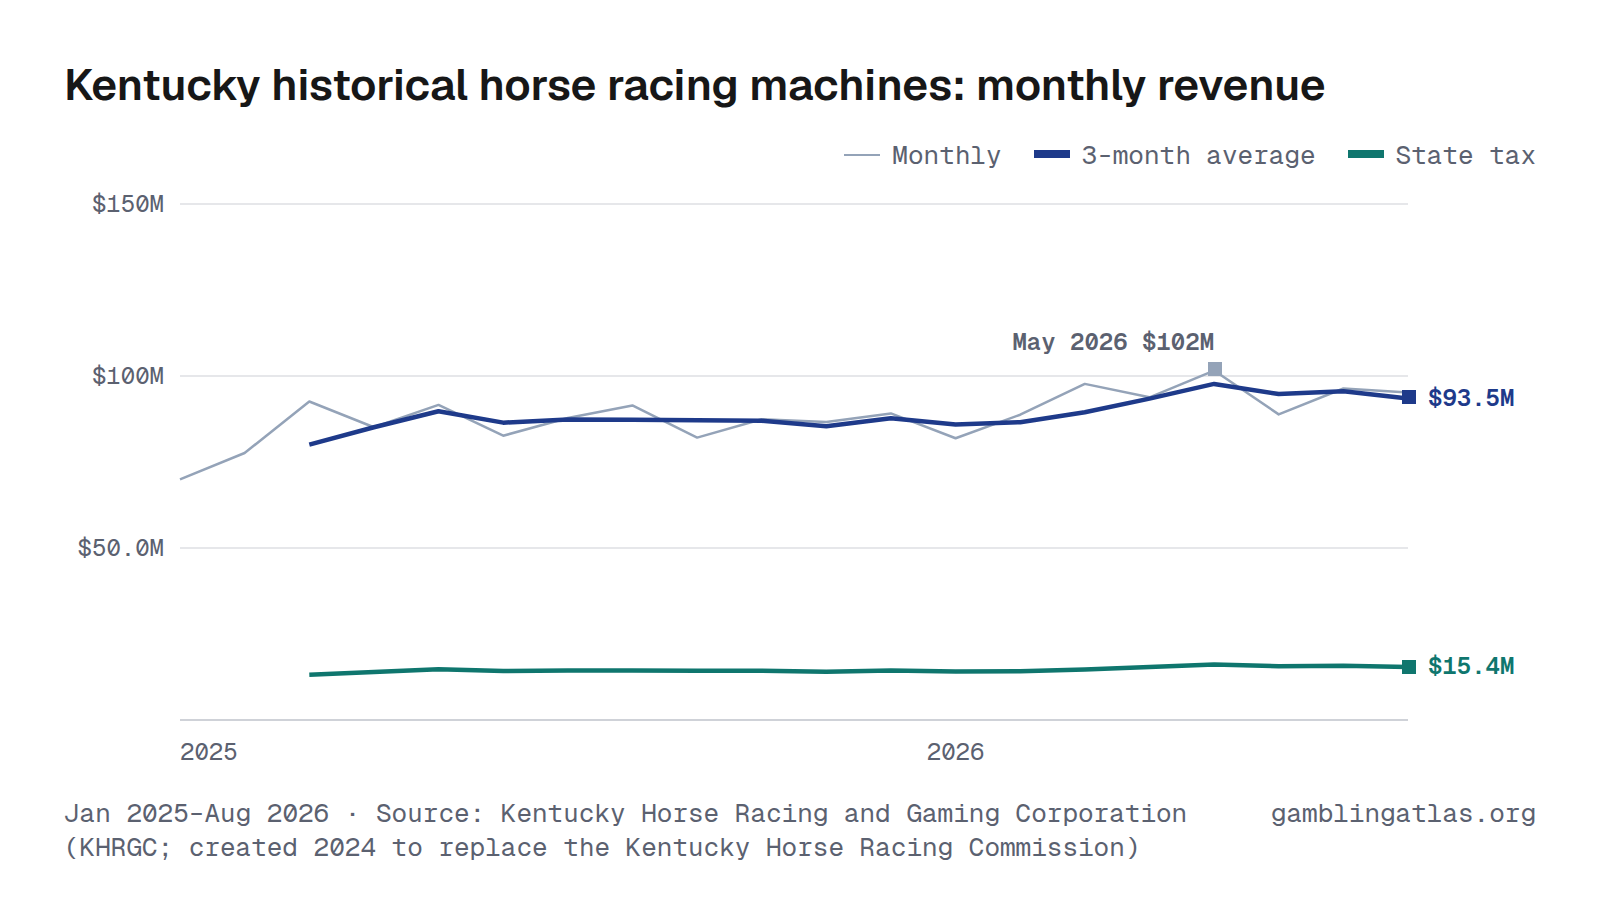
Kentucky historical horse racing machines produced $95.2M in gross gaming revenue in August 2026, up 4% from Aug 2025. Over the 12 months through Aug 2026, revenue totaled $1.09B on $11.9B in bets, a 9.1% hold, and the state collected $179M in tax.
The highest month on record here is May 2026 ($102M). Monthly figures run from Jan 2025 to Aug 2026 and come from the Kentucky Horse Racing and Gaming Corporation (KHRGC; created 2024 to replace the Kentucky Horse Racing Commission).
Jan 2025–Aug 2026 · Source: Kentucky Horse Racing and Gaming Corporation (KHRGC; created 2024 to replace the Kentucky Horse Racing Commission) · Kentucky revenue
Handle (amount bet)
Download, embed or cite
Free to reuse with a link to this page. License and sources
Data
| Month | Handle | Revenue (GGR) | Hold | State tax |
|---|---|---|---|---|
| Aug 2026 | $1.05B | $95.2M | 9.1% | $15.7M |
| Jul 2026 | $1.06B | $96.4M | 9.1% | $15.9M |
| Jun 2026 | $974M | $88.8M | 9.1% | $14.6M |
| May 2026 | $1.12B | $102M | 9.1% | $16.8M |
| Apr 2026 | $1.03B | $93.8M | 9.1% | $15.5M |
| Mar 2026 | $1.07B | $97.7M | 9.1% | $16.1M |
| Feb 2026 | $971M | $88.7M | 9.1% | $14.6M |
| Jan 2026 | $895M | $81.9M | 9.2% | $13.4M |
| Dec 2025 | $974M | $89.1M | 9.2% | $14.6M |
| Nov 2025 | $948M | $86.7M | 9.1% | $14.2M |
| Oct 2025 | $958M | $87.4M | 9.1% | $14.4M |
| Sep 2025 | $900M | $82.1M | 9.1% | $13.5M |
| Aug 2025 | $1.00B | $91.4M | 9.1% | $15.0M |
| Jul 2025 | $963M | $87.8M | 9.1% | $14.5M |
| Jun 2025 | $907M | $82.6M | 9.1% | $13.6M |
| May 2025 | $1.00B | $91.6M | 9.1% | $15.0M |
| Apr 2025 | $933M | $85.1M | 9.1% | $14.0M |
| Mar 2025 | $1.01B | $92.6M | 9.1% | $15.2M |
| Feb 2025 | $851M | $77.6M | 9.1% | $12.8M |
| Jan 2025 | $766M | $69.9M | 9.1% | $11.5M |
| Year | Handle | Revenue (GGR) | State tax |
|---|---|---|---|
| 2026 | $8.17B (8 mo) | $744M (8 mo) | $122M (8 mo) |
| 2025 | $11.2B | $1.02B | $168M |
Years with missing months show partial totals, marked with the number of months reported.
| Operator | Handle | GGR |
|---|---|---|
| Churchill Downs Incorporated | $2.67B | $241M |
| Kentucky Downs | $2.63B | $239M |
| Oak Grove Racing, Gaming & Hotel | $2.11B | $189M |
| Red Mile (unmatched) | $1.30B | $117M |
| Turfway Park (unmatched) | $841M | $78.9M |
| ECL Entertainment | $666M | $63.4M |
| Owensboro (unmatched) | $589M | $54.8M |
| Newport (unmatched) | $434M | $40.6M |
| Sandy's Racing and Gaming | $433M | $39.1M |
| Henderson (unmatched) | $275M | $26.5M |
License-holder totals may include partner-operated brands. “(unmatched)” rows show the regulator's reported name with no linked operator record here — that can be an operator not yet matched, or a non-operator reporting channel (e.g. a lottery's own retail-location sales) rather than a licensed sportsbook or casino.
Notes
GGR is the dashboard's "Gross Commission - Win" line, by racing facility, before promotional credits. Adjusted revenue is the dashboard's "Adjusted Commission - Win" line, the statutory tax base. Tax paid is the dashboard's "Excise Tax - HHR" line. KHRGC's own HHR Wagering dashboard only exposes a trailing window of recent months, not the program's full history since its original launch, so this series begins 2025-01 rather than at HHR's actual start.