Florida Card Room Revenue by Month
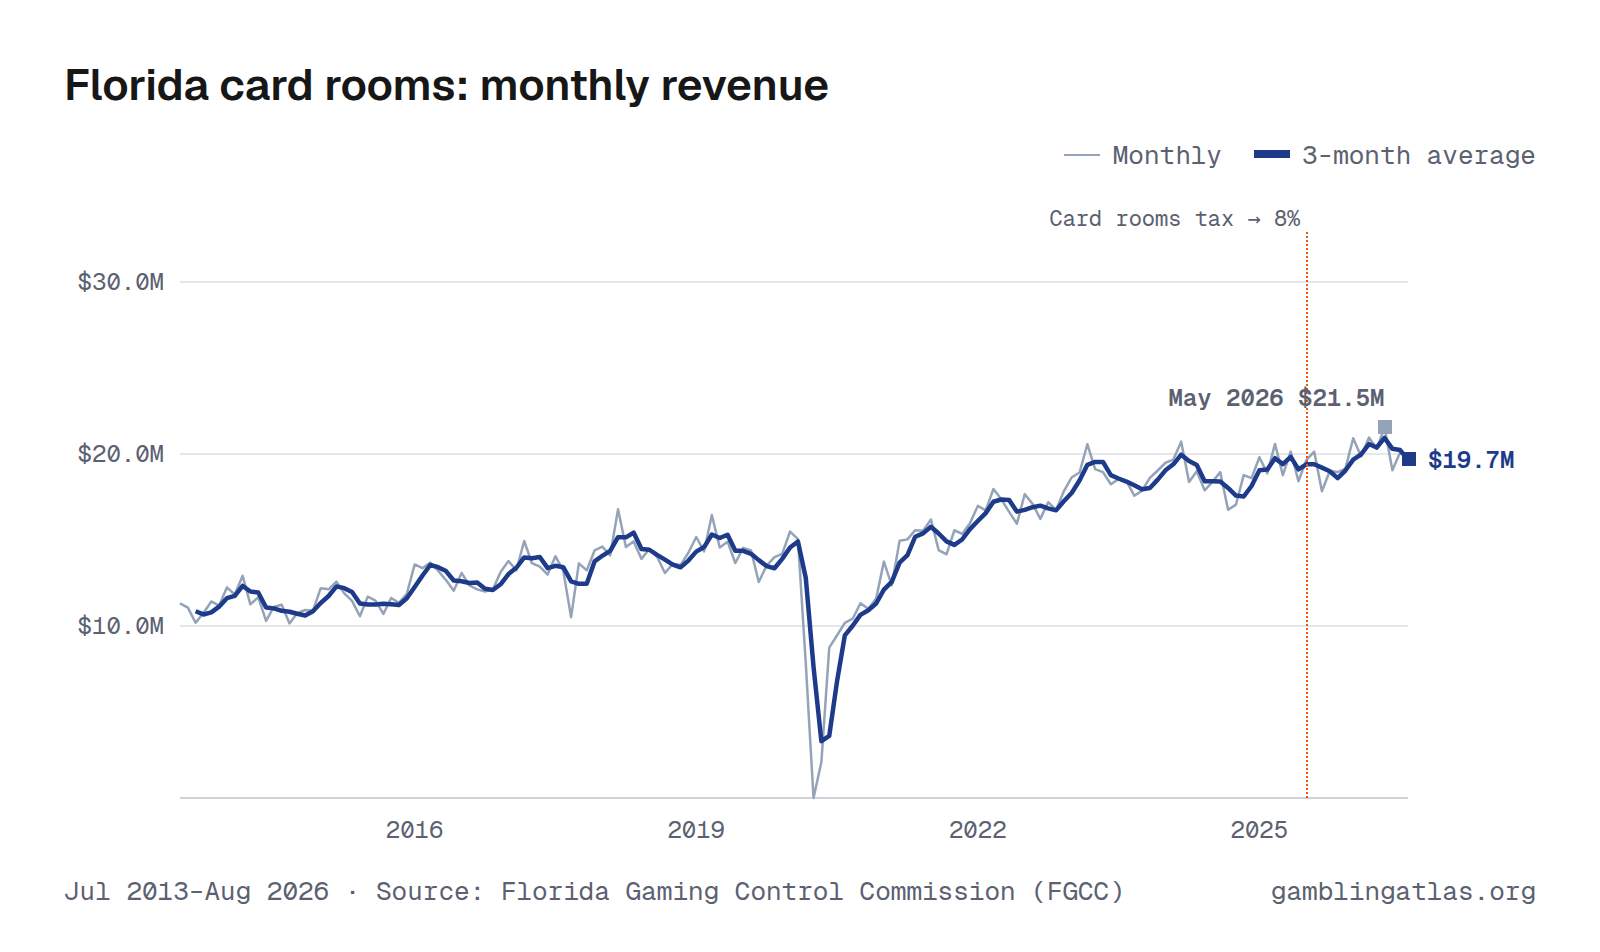
Florida card rooms produced $19.8M in gross gaming revenue in August 2026, down 2% from Aug 2025. Over the 12 months through Aug 2026, revenue totaled $237M.
The highest month on record here is May 2026 ($21.5M). Monthly figures run from Jul 2013 to Aug 2026 and come from the Florida Gaming Control Commission (FGCC).
Jul 2013–Aug 2026 · Source: Florida Gaming Control Commission (FGCC) · Florida revenue
Download, embed or cite
Free to reuse with a link to this page. License and sources
Data
| Month | Revenue (GGR) | State tax |
|---|---|---|
| Aug 2026 | $19.8M | |
| Jul 2026 | $20.1M | |
| Jun 2026 | $19.1M | |
| May 2026 | $21.5M | |
| Apr 2026 | $20.3M | |
| Mar 2026 | $21.0M | |
| Feb 2026 | $19.9M | |
| Jan 2026 | $20.9M | |
| Dec 2025 | $19.2M | |
| Nov 2025 | $18.9M | |
| Oct 2025 | $19.0M | |
| Sep 2025 | $17.8M | |
| Aug 2025 | $20.1M | |
| Jul 2025 | $19.6M | |
| Jun 2025 | $18.4M | |
| May 2025 | $20.1M | |
| Apr 2025 | $18.8M | |
| Mar 2025 | $20.6M | |
| Feb 2025 | $18.9M | |
| Jan 2025 | $19.8M | |
| Dec 2024 | $18.6M | |
| Nov 2024 | $18.8M | |
| Oct 2024 | $17.1M | |
| Sep 2024 | $16.8M | |
| Aug 2024 | $18.9M | |
| Jul 2024 | $18.4M | |
| Jun 2024 | $17.9M | |
| May 2024 | $19.0M | |
| Apr 2024 | $18.4M | |
| Mar 2024 | $20.7M | |
| Feb 2024 | $19.7M | |
| Jan 2024 | $19.5M | |
| Dec 2023 | $19.0M | |
| Nov 2023 | $18.6M | |
| Oct 2023 | $17.9M | |
| Sep 2023 | $17.6M | |
| Aug 2023 | $18.4M | |
| Jul 2023 | $18.5M | |
| Jun 2023 | $18.2M | |
| May 2023 | $18.9M | |
| Apr 2023 | $19.1M | |
| Mar 2023 | $20.6M | |
| Feb 2023 | $18.9M | |
| Jan 2023 | $18.6M | |
| Dec 2022 | $17.8M | |
| Nov 2022 | $16.7M | |
| Oct 2022 | $17.2M | |
| Sep 2022 | $16.2M | |
| Aug 2022 | $17.1M | |
| Jul 2022 | $17.7M | |
| Jun 2022 | $15.9M | |
| May 2022 | $16.6M | |
| Apr 2022 | $17.4M | |
| Mar 2022 | $18.0M | |
| Feb 2022 | $16.7M | |
| Jan 2022 | $17.0M | |
| Dec 2021 | $16.0M | |
| Nov 2021 | $15.4M | |
| Oct 2021 | $15.6M | |
| Sep 2021 | $14.2M | |
| Aug 2021 | $14.4M | |
| Jul 2021 | $16.2M | |
| Jun 2021 | $15.5M | |
| May 2021 | $15.6M | |
| Apr 2021 | $15.0M | |
| Mar 2021 | $15.0M | |
| Feb 2021 | $12.4M | |
| Jan 2021 | $13.7M | |
| Dec 2020 | $11.6M | |
| Nov 2020 | $11.0M | |
| Oct 2020 | $11.3M | |
| Sep 2020 | $10.4M | |
| Aug 2020 | $10.2M | |
| Jul 2020 | $9.4M | |
| Jun 2020 | $8.7M | |
| May 2020 | $2.1M | |
| Apr 2020 | $0 | |
| Mar 2020 | $7.8M | |
| Feb 2020 | $15.1M | |
| Jan 2020 | $15.5M | |
| Dec 2019 | $14.2M | |
| Nov 2019 | $14.0M | |
| Oct 2019 | $13.5M | |
| Sep 2019 | $12.6M | |
| Aug 2019 | $14.4M | |
| Jul 2019 | $14.5M | |
| Jun 2019 | $13.7M | |
| May 2019 | $14.9M | |
| Apr 2019 | $14.6M | |
| Mar 2019 | $16.5M | |
| Feb 2019 | $14.3M | |
| Jan 2019 | $15.2M | |
| Dec 2018 | $14.3M | |
| Nov 2018 | $13.5M | |
| Oct 2018 | $13.6M | |
| Sep 2018 | $13.1M | |
| Aug 2018 | $14.0M | |
| Jul 2018 | $14.5M | |
| Jun 2018 | $13.9M | |
| May 2018 | $14.9M | |
| Apr 2018 | $14.6M | |
| Mar 2018 | $16.8M | |
| Feb 2018 | $14.1M | |
| Jan 2018 | $14.6M | |
| Dec 2017 | $14.4M | |
| Nov 2017 | $13.2M | |
| Oct 2017 | $13.6M | |
| Sep 2017 | $10.5M | |
| Aug 2017 | $13.2M | |
| Jul 2017 | $14.1M | |
| Jun 2017 | $13.0M | |
| May 2017 | $13.4M | |
| Apr 2017 | $13.6M | |
| Mar 2017 | $14.9M | |
| Feb 2017 | $13.2M | |
| Jan 2017 | $13.8M | |
| Dec 2016 | $13.1M | |
| Nov 2016 | $12.1M | |
| Oct 2016 | $12.0M | |
| Sep 2016 | $12.1M | |
| Aug 2016 | $12.4M | |
| Jul 2016 | $13.1M | |
| Jun 2016 | $12.1M | |
| May 2016 | $12.7M | |
| Apr 2016 | $13.2M | |
| Mar 2016 | $13.7M | |
| Feb 2016 | $13.4M | |
| Jan 2016 | $13.6M | |
| Dec 2015 | $11.9M | |
| Nov 2015 | $11.3M | |
| Oct 2015 | $11.6M | |
| Sep 2015 | $10.7M | |
| Aug 2015 | $11.5M | |
| Jul 2015 | $11.7M | |
| Jun 2015 | $10.6M | $1.1M |
| May 2015 | $11.5M | $1.1M |
| Apr 2015 | $11.9M | $1.2M |
| Mar 2015 | $12.6M | $1.3M |
| Feb 2015 | $12.1M | $1.2M |
| Jan 2015 | $12.2M | $1.2M |
| Dec 2014 | $10.9M | $1.1M |
| Nov 2014 | $10.9M | $1.1M |
| Oct 2014 | $10.7M | $1.1M |
| Sep 2014 | $10.1M | $1.0M |
| Aug 2014 | $11.2M | $1.1M |
| Jul 2014 | $11.1M | $1.1M |
| Jun 2014 | $10.3M | $1.0M |
| May 2014 | $11.7M | $1.2M |
| Apr 2014 | $11.3M | $1.1M |
| Mar 2014 | $12.9M | $1.3M |
| Feb 2014 | $11.8M | $1.2M |
| Jan 2014 | $12.2M | $1.2M |
| Dec 2013 | $11.2M | $1.1M |
| Nov 2013 | $11.4M | $1.1M |
| Oct 2013 | $10.8M | $1.1M |
| Sep 2013 | $10.2M | $1.0M |
| Aug 2013 | $11.1M | $1.1M |
| Jul 2013 | $11.3M | $1.1M |
| Year | Revenue (GGR) | State tax |
|---|---|---|
| 2026 | $163M (8 mo) | |
| 2025 | $231M | |
| 2024 | $224M | |
| 2023 | $224M | |
| 2022 | $204M | |
| 2021 | $179M | |
| 2020 | $113M | |
| 2019 | $172M | |
| 2018 | $172M | |
| 2017 | $161M | |
| 2016 | $153M | |
| 2015 | $140M | $7.1M (6 mo) |
| 2014 | $135M | $13.5M |
| 2013 | $65.9M (6 mo) | $6.6M (6 mo) |
Years with missing months show partial totals, marked with the number of months reported.
| Operator | GGR |
|---|---|
| bestbet Jacksonville (unmatched) | $29.4M |
| Derby Lane (unmatched) | $21.2M |
| Orange City Racing and Card Club (unmatched) | $20.5M |
| Palm Beach Kennel Club (unmatched) | $15.3M |
| Bonita Springs Poker Room (unmatched) | $12.9M |
| bestbet Orange Park (unmatched) | $11.4M |
| Daytona Beach Racing and Card Club (unmatched) | $11.3M |
| Oxford Downs (unmatched) | $11.0M |
| Gretna Racing, LLC | $10.3M |
| PPI, Inc. | $9.9M |
| bestbet St. Augustine (unmatched) | $9.4M |
| Melbourne Greyhound Park (unmatched) | $8.7M |
| One-Eyed Jack's Poker Room (unmatched) | $8.7M |
| Casino Ft. Pierce / Card House (unmatched) | $8.1M |
| Ebro Greyhound Park (unmatched) | $7.5M |
| Ocala Bets (unmatched) | $7.1M |
| Dania Entertainment Center, LLC | $6.3M |
| Tampa Bay Downs (unmatched) | $5.6M |
| Hialeah Park (unmatched) | $5.2M |
| 831 Federal Highway Acquisition, LLC | $5.0M |
| Pensacola Greyhound Park (unmatched) | $4.9M |
| Lucky's Card Room (unmatched) | $3.2M |
| Creek Entertainment Gretna (unmatched) | $2.1M |
| Casino Miami, LLC | $1.5M |
| Calder Casino (unmatched) | $1.0M |
| Hamilton Downs (unmatched) | $231 |
| Ocala Gainesville Poker (unmatched) | $0 |
| The Stronach Group | $0 |
License-holder totals may include partner-operated brands. “(unmatched)” rows show the regulator's reported name with no linked operator record here — that can be an operator not yet matched, or a non-operator reporting channel (e.g. a lottery's own retail-location sales) rather than a licensed sportsbook or casino.
Notes
GGR is the report's gross receipts from regular play plus tournament play, before promotional credits. Tax paid is the report's gross receipts tax (8% under Fla. Stat. 849.086), printed only for fiscal years 2013-14 and 2014-15. The Florida Gaming Control Commission's "Cardroom Gross Receipts From Regular Play and Tournament Play" report, cumulative by fiscal year (July to June). Card room names are matched to the report's permit numbers.
Sources
- FGCC Cardroom Gross Receipts From Regular Play and Tournament Play, FY2021/
- FGCC Cardroom Gross Receipts From Regular Play and Tournament Play, FY2022/
- FGCC Cardroom Gross Receipts From Regular Play and Tournament Play, FY2023/
- FGCC Cardroom Gross Receipts From Regular Play and Tournament Play, FY2024/
- FGCC Cardroom Gross Receipts From Regular Play and Tournament Play, FY2025/
- FGCC Cardroom Gross Receipts From Regular Play and Tournament Play, FY2026/